Category: Industry News

  • State Farm Service Agency Director named Almond Champion of the Year

    State Farm Service Agency Director named Almond Champion of the Year

    Connie Conway, Director of the USDA Farm Service Agency in California, has been honored as the Almond Alliance of California’s 2020 Almond Champion of the Year for the agency’s outstanding efforts in assisting almond growers with the Coronavirus Food Assistance Program (CFAP.)

    The Almond Champion of the Year Award is presented annually to those who have demonstrated extraordinary leadership in education, coalition building, partnerships and promoting legislation and policies that encourage the advancement and protection of California agriculture and the California almond industry.

    The CFAP consists of direct payments to almond growers for losses suffered as a result of COVID-19 as well as disruptions to the supply chain. The Almond Alliance advocated for federal funding for the original program and the subsequent program known as CFAP 2. To date, the California almond community has received over $125 million through the programs.

    The Farm Service Agency (FSA) administers the funding and provides technical assistance to potential applicants. Almond Alliance Chair Mike Curry praised Conway for her leadership in providing access to the program. “Some of these programs can be incredibly technical and complex. Connie and her team have been very attentive and worked with our industry members above and beyond what would normally be expected,” he explained. “Her team has conducted numerous educational webinars for our members and addressed literally hundreds of questions about the program and how it works. Her leadership and commitment to excellence in providing this assistance during these unprecedented times is truly appreciated.”

    Prior to her appointment, Conway ran her own consulting business, focusing on strategic planning, business development, and government relations services. She also served as an assemblywoman for the California State Legislature where she served as Minority Leader and on the Agriculture, Transportation, Labor and Health Committees. She also served as a member of the Tulare County Board of Supervisors.

    About the Almond Alliance of California

    The Almond Alliance of California (AAC) is a trusted non-profit organization dedicated to advocating on behalf of the California almond community. California almonds generate more than $21 billion in economic revenue and directly contribute more than $11 billion to the state’s total economy. California’s top agricultural export, almonds create approximately 104,000 jobs statewide, over 97,000 in the Central Valley, which suffers from chronic unemployment. The AAC is dedicated to educating state legislators, policy makers and regulatory officials about the California almond community. As a membership-based organization, our members include almond processors, hullers/shellers, growers and allied businesses. Through workshops, newsletters, conferences, social media and personal meetings, AAC works to raise awareness, knowledge and provide a better understanding about the scope, size, value and sustainability of the California almond community.


    For more information on the Almond Alliance, visit https://almondalliance.org/ or check out the Almond Alliance on Facebook, Twitter and Instagram.

  • Blue Diamond Growers 110th Annual Meeting Recap, Gurcharan Dhillon Honored

    Blue Diamond Growers 110th Annual Meeting Recap, Gurcharan Dhillon Honored

    The 110th Blue Diamond Growers Annual Meeting countered the challenges of 2020 with a sense of accomplishment for the present and optimism for the future.

    “We are a growth business by choice, and I’m confident in declaring that the best is yet to come,” said Mark Jansen, President and CEO, Blue Diamond Growers.

    In his virtual presentation to Blue Diamond almond growers on Nov. 18, Jansen acknowledged the numerous obstacles the co-op overcame during the past year due to the COVID-19 pandemic and other factors.

    “With trade wars, port-related receiving disruptions, market price corrections, foodservice shut-downs, and a fire at the Sacramento Blue Diamond plant, it was a tough year to sell almonds,” said Jansen. “Yet, Blue Diamond prevailed in continuing to build a remarkably strong business in support of a 3-billion-pound almond crop – the largest ever in our 110-year history.”

    Mark Jansen

    Jansen reported that in 2020 alone, Blue Diamond was able to:

    • Provide growers a 16-cent competitive advantage per pound of almonds delivered.
    • Complete a multi-year construction plan including the addition of a 50-million-pound-capacity raw almond warehouse in Salida, Calif. The new warehouse is the second facility of similar capacity recently built at the site.
    • Incorporate engineering upgrades and expand a high-efficiency production line for Almond Breeze® almondmilk at the Blue Diamond facility in Turlock, Calif. The newly enhanced line more than doubles the plant’s Almond Breeze production volume. Almond Breeze leads as the co-op’s most profitable product with more than $800 million in annual retail sales.
    • Increase direct sales into India by 40 percent as trade pressures dramatically curtailed access into the Chinese market.
    • More than double e-commerce sales of Blue Diamond products, while achieving the goal of Amazon becoming the co-op’s fifth largest customer.
    • Be recognized, for the fourth consecutive year, as an IRI Growth Leader for fastest-growing consumer-packaged goods sales in terms of volume, revenue and market share.
    • Achieve its fifth consecutive year – representing five million work hours – of no lost-time accidents at the Salida facility.
    Dan Cummings

    Blue Diamond Board Chairman Recognizes Leadership Milestone and Co-op Honor  
    In addition to the business performance highlights shared by Jansen, Dan Cummings, Blue Diamond Board Chairman and Director, District 1, announced Jansen’s tenth anniversary as President and CEO of Blue Diamond Growers. Cummings made note of Jansen’s remarkable leadership and accomplishments on behalf of the co-op.  “We are confident in the future with Mark’s great leadership to guide us,” said Cummings. “Considering the successes so far, we can only imagine what the next10 years will bring. Blue Diamond is in great hands with him.”

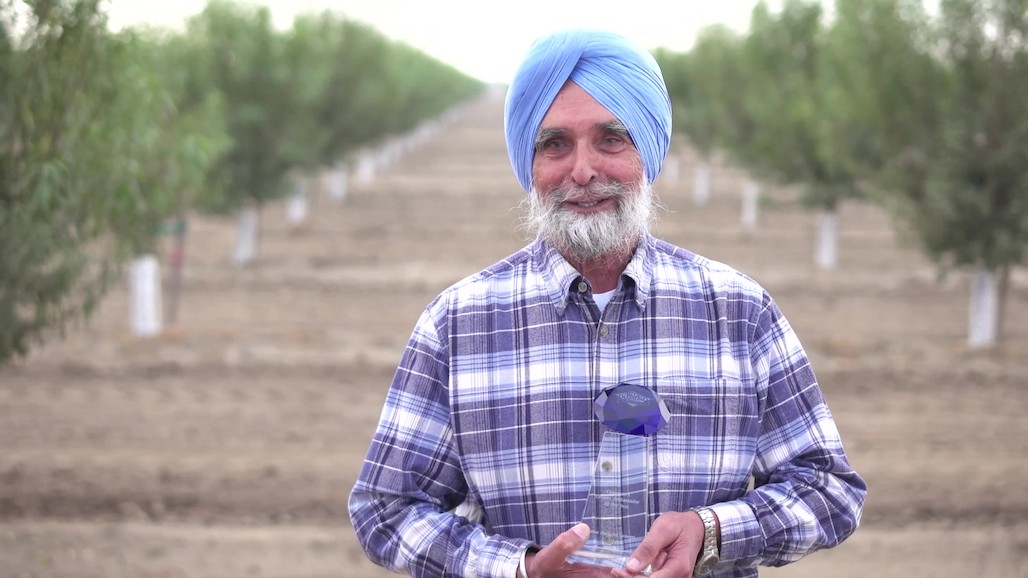
    Additionally, Cummings announced Gurcharan Dhillon as the 2020 Chairman’s Grower Ambassador of the Year. Dhillon serves as a Grower Liaison Committee Member for District 9, and he is also active on Almond Board of California committees.  “We thank Gurcharan for his outstanding service and unwavering commitment to the co-op and the almond industry. He is truly an inspired leader,” said Cummings. “We also thank our many partners, including haulers, shellers, truck drivers, co-manufacturers, marketers and the 1,800 Blue Diamond employees who go above and beyond each day to help provide Blue Diamond almonds to the world.”

    About Blue Diamond

    Blue Diamond Growers, a grower-owned cooperative representing over 3,000 of California’s almond growers, is the world’s leading almond marketer and processor. Established in 1910, it created the California almond industry and opened world markets for almonds. Blue Diamond is dedicated to delivering the benefits of almonds around the world and does so by providing high-quality almonds, almond ingredients, and branded products. Headquartered in Sacramento, the company employs more than 1,800 people throughout its processing plants, receiving stations and gift shops. To learn more about Blue Diamond Growers, visit www.bluediamond.com and follow the company on FacebookInstagramLinkedIn and Twitter.

  • US Maintains Position as India’s Top Tree Nut Importer as Demand Surges

    US Maintains Position as India’s Top Tree Nut Importer as Demand Surges

    India’s tree nut imports continue to surge, with demand growing despite a tariff stranglehold. Consumption is growing as a result of the expanded perception of the health benefits of almonds and walnuts among middle- class consumers. FAS New Delhi forecasts in marketing year 2020/2021 Indian almond imports to reach 115,000 metric tons (MT). While walnut imports are forecast to reach 32,000 metric tons. Trade volumes can potentially be higher if it were not for Government of India imposed trade barriers (both tariff and non-tariff). 

    ALMONDS, SHELLED BASIS

    PRODUCTION:

    FAS New Delhi (Post) forecasts marketing year (MY) 2020/2021 (August-July) Indian almond production at 4,500 metric tons (MT) (kernel-weight basis), up seven percent on a year-on-year basis. More favorable weather conditions and new tree varieties are helping to increase production. Almond production is concentrated in the union territories of Jammu and Kashmir and in Himachal Pradesh. Shelling rates range between 20 and 30 percent for hard-shell varieties, and 40 percent for thin-shelled varieties.

    Post revises downward to 4,200 MT the MY 2019/2020 production estimate, down 300 MT compared to the U.S. Department of Agriculture (USDA) official figure of 4,500 metric tons. The lower number is due to an increase in the number of non-bearing trees observed, despite there being no changes in the area planted. The union territory government of Jammu and Kashmir through its Almond Development program aims to increase by 12,000 hectares the almond cultivation area, and in the process, phase in new higher yielding cultivars.

    CONSUMPTION:

    FAS New Delhi forecasts MY 2020/2021 Indian almond consumption at 125,000 MT, up nine percent from the MY 2019/2020 volume of 114,500 metric tons. The increase is due to strong, steady growth in household consumption of almonds, perceived as a healthy and immunity building snack nut at a time of expanded health concerns. A key factor facilitating driving greater consumption, notwithstanding the novel coronavirus (COVID-19) lockdown, is the rise of e-commerce platforms. With growing numbers of consumers shopping now online for groceries, almonds are making their way onto online shopping carts in greater quantities.

    With India’s middle-class (300-350 million) expansion, there is growing awareness of, and demand for healthy foods. The COVID-19 pandemic accelerated almond consumption in this country of 1.3 billion (Central Intelligence Agency July 2020 estimate). Perceived nutritional benefits of almonds as a food ‘good for the brain’ and its ‘immunity building characteristics’ are being used to tackle the pandemic. This is resulting in fundamental changes in consumer behavior that will last even after a COVID-19 vaccine is developed. Almonds are today displacing cashews as health-conscious consumers’ nut of choiceA reliable, steady supply combined with growing consumer awareness of the health benefits of almonds, is leading to almonds expanded use as a food ingredient by the Indian food processing industry. Almonds are making their way in greater numbers into breakfast cereal bars, snack foods, beverages, and confectionaries manufactures, as well as the in personal care industry (utilizing almond oil).

    PRICES:

    India is price-sensitive consumer market. Consumers favor affordably priced almonds, and in particular, quintessential California non-pareil almonds that are uniform in size and ‘eye’ shaped and count with the sweetness desired. Australia-origin non-pareil almonds and Carmel (often used for blanching and roasting) varieties account for a growing segment of the market. Iranian Mamra and Oumi varieties are popular in India’s western and northwestern regions (i.e., the National Capital Region – New Delhi, Rajasthan, and Gujarat) and often command price-premiums.

    Favorable Californian crop production and ample supply along with COVID-19 containment measures are driving down almond average prices compared to MY 2019/2020. Almonds will command higher pricing once the Indian hotel-restaurant-institutional (HRI) sector’s own demand for almonds picks up in 2021/2022.

    TRADE:

    FAS New Delhi forecasts MY 2020/2021 Indian almond imports at 115,000 MT, up nearly 10 percent from the USDA official MY 2019/2020 estimate of 105,000 metric tons. Post’s earlier MY 2019/2020 estimate is six percent higher compared to the previous year despite an increase in the basic-customs-duty (see PIB and GAIN-INDIA (IN2019) Government of India GOI Raises Tariffs on Specific U.S. Ag Products (June 16, 2019). Although shipments of almonds to India increased between January and August 2020, the post-Diwali festive season (when demand for tree nuts normally peaks) will be a bit leaner this year compared to 2019.

    U.S.-origin almonds account for 81 percent of India’s total import volume in MY 2019/2020; Australian almonds come in second with seven percent of the import volume. Almond imports from the United States and Australia are in shell, non-pareil or Carmel varieties, and are shelled locally (machine cracked and hand sorted); other origins supply shelled almonds. Packaged almonds only account for 10 percent of retail sales.

    FAS New Delhi forecasts MY 2020/2021 Indian almond exports at 200 MT, down by 20 MT or nine percent lower compared to the MY 2019/2020 estimate. India’s exports of almonds remain negligible. Exports in MY 2019/2020 are estimated at 220 MT; with the United Kingdom (28 percent), Nepal (14 percent), and the United Arab Emirates (13 percent) being the main export destinations by volume.

    POLICY:

    India does not set quantitative restrictions on almond imports. U.S.-origin almonds, however, face retaliatory tariffs of India rupees (INR) 41/kilogram (kg) (in shell basis) and INR 120/kg (shelled basis). (FOREX: INR 73.92 to $1.00).

    On May 23, 2018, the Indian government issued notifications announcing an increase in the basic-common-duty on several imported agricultural products, including shelled almonds. The tariff increases are applicable to all third-country suppliers. The tariff on shelled almonds increased from INR 65/Kg to INR 100/kg, and significantly restricts trade (see GAIN-INDIA (IN2018-8067) Government of India Increases Tariffs on Certain Agricultural Imports (June 7, 2018). 

    Non-tariff barriers include a third amendment to the Almond Kernel Standards, published by the Food Safety and Standards Authority of India (FSSAI) on August 14, 2020. The standards’ implementation date is set for July 1, 2021 (see GAIN-INDIA (2020-0103) Almond Kernel Standards and Other Various Food Products Published in the Indian Gazette (August 24, 2020).

    Industry sources indicate that the proposed almond kernels standards are too prescriptive to be widely applied across multiple commercial grades. Proposed quality/grade factors pertain to commercial contracts and should not form the basis for import or retail controls. Traders sustain that there is a need for flexibility in grades to account for varying commercial situations, including varietal differences, crop quality variability, and pricing differentials. For these, physical parameters such as damage and the presence of foreign material should not form the basis of import controls.

    Despite these challenges, FAS New Delhi continues to identify market development opportunities, particularly among markets serving children, young adults, and the growing urban work force. Additional opportunities exist with medium- and large-scale bakeries, boutique/artisan patisseries, food processors, such as cookie manufacturers and breakfast cereal companies, consumer packaged goods, and institutional end users. Regions in southern and eastern India offer new, worthwhile marketing opportunities.

    WALNUTS, IN SHELL BASIS
    PRODUCTION:

    FAS New Delhi forecasts MY 2020/2021 (September-August) Indian walnut production at 35,000 MT (in shell basis), a volume largely unchanged from the previous marketing year’s estimate. Indian walnut production is cyclical in nature and yields can vary by as much as 20 percent, depending on weather conditions at the time of blossom and harvest.

    India’s walnut harvest runs from late August through September, with market arrivals peaking in late October. Walnut production is concentrated in Jammu and Kashmir, Himachal Pradesh, and Uttarakhand. Lack of adequate infrastructure in the production areas, long gestation periods, poor orchard management, and uneven yields limit India’s walnut production. India produces hard, medium, or thin shell (kaghazi) walnut types, with an average shelling rate of about 40 percent.

    CONSUMPTION:

    FAS New Delhi forecasts MY 2020/2021 Indian walnut consumption at 60,000 MT, roughly 20 percent above its MY 2019/2020 estimate of 50,000 metric tons. Increases in consumption levels is attributable to greater at home consumption of walnuts during the COVID-19 pandemic outbreak in pursuit of health-related benefits.

    Higher walnut consumption stems from the growing perception among Indian middle-class consumers that walnuts help to reduce cholesterol, improve brain health, and lower risks of diabetes, among other health benefits. The Indian government’s FSSAI issued the public guidance document titled “Eating Right during COVID-19” encouraging the intake of walnuts for their nutritional benefits (especially as it pertains to Omega- 3 fatty acids, Vitamin B-9, Protein, Zinc, and Selenium concentrations). With people confined to their homes during the lockdown, consumption of walnuts increased significantly in 2020. 

    Indian walnut consumption is growing steady since MY 2015/2016 through MY 2019/2020, by almost 15 percent. Strong growth is indicative of the presence of a consistent supply to meet strong domestic demand. Packaging innovations (e.g., vacuum-packed bags, combined with attractive product packaging) is improving the shelf life and quality of walnuts, while encouraging year-round consumption. The rise of new distribution channels such as e-commerce websites are driving consumption and availability of walnuts. Between 70 and 75 percent of Indian walnuts are consumed domestically, and more than half of Indian walnuts are consumed during the holiday, festive, and winter seasons. Industry sources estimate that roughly 17 percent of walnuts go into food processing, with another four percent crushed for the personal care industry.

    PRICES:

    Domestic walnut prices were weak from January 2019 to September 2019. Prices saw improvement during the peak 2019 demand period towards the end of the year, with the upward trend in prices running through 2020. In the wholesale market, imported walnut (in shell) prices in 2020 range INR 52,500 ($710) to INR 60,000 ($812) per 100 kilograms. (FOREX: INR 73.92 to $1.00).

    TRADE:

    FAS New Delhi forecasts MY 2020/2021 Indian walnuts imports at 32,000 MT, up nearly seven percent or 2,000 MT greater than the USDA official 2019/2020 estimate of 30,000 metric tons. The United States will remain the dominant supplier with a 54 percent market share, followed by Chile at 40 percent.

    India is primarily an in shell walnuts market. Trade sources indicate that Indian imports of in shell walnuts grew 46 percent between January and August 2020, while shelled walnuts imports rose by an astonishing 329 percent during that same period.

    FAS New Delhi forecasts MY 2020/2021 Indian walnuts exports at 4,000 MT, up 800 MT or 25 percent higher than the USDA official MY 2019/2020 estimate of 3,200 metric tons. Indian walnuts exports declined in MY 2019/2020 due to high domestic demand for product, which will ease somewhat this year. Walnuts from India will make their way again to the traditional export destinations of France, the United Kingdom, and Germany. 

    Over 95 percent of Indian walnut exports go out as kernels in vacuum packs (35-40 percent light halves, 35-40 percent amber halves/light broken, and the remaining balance as amber halves). Market sources report that Indian walnuts compete with those from the United States, Mexico, Chile, Turkey, China, and Ukraine.

    TRADE POLICY

    India’s Open License program permits the import of walnuts without quantitative restrictions. In shell walnut imports, however, are subject to a 100 percent tariff, and shelled walnuts are similarly subject to a 100 percent tariff (effective February 2020). Afghanistan-origin import shipments face a lower, 50 percent tariff due to the enactment of the Indo-Afghan Preferential Trade Agreement.

    India is implementing a retaliatory tariff on U.S.-origin walnuts at 20 percent above the applied basic-common-duty of 100 percent. U.S. shipments of walnuts suffered from this measure in MY 2018/2019. However, California walnuts remain in the Indian market, counting with high consumer demand to help drive volumes.

    Post identified non-tariff barriers to trade include the Walnut Kernel Regulation published by the Indian government’s FSSAI on September 3, 2020 (see GAIN-INDIA (2020-0121) FSSAI Proposes Draft Standards for Walnut Kernels and Other Various Food Products). The effective implementation date is either January 1, 2021, or alternatively July 1, 2021, depending on when the amendment is published in the official gazette. The published standards are non-transparent, ambiguous, and likely difficult to adhere to; particularly as it pertains to moisture levels, foreign matter, damaged units, acidity, color, acid-insoluble ash, and extraneous vegetable matter. These standards deviate from globally established practices.

    India, given its huge market size, and despite the challenges, remains an attractive market especially as it relates to the Indian sweets and snacks industry. — By Ankit Chandra & Mariano J. Beillard, USDA Foreign Agricultural Service

  • Navel Orangeworm Winter Sanitation Considerations

    Navel Orangeworm Winter Sanitation Considerations

    Winter sanitation is a critical step in your Navel Orangeworm IPM programs. But when should you start and is it enough just to shake those mummy nuts off of the trees? Watch this interview with Bob Klein from the California Pistachio Research Board as he shares some key insights growers should consider when approaching winter sanitation and read about it in Pacific Nut Producer Magazine.

  • ANNOUNCING TOMRA 5C – A More Successful Future Awaits

    ANNOUNCING TOMRA 5C – A More Successful Future Awaits

    – SPONSORED CONTENT –

    As an innovative thought leader for nearly 50 years, TOMRA Food has brought many firsts to the industry, and now we bring you one more. We continue to raise the bar for food safety and product quality. We continue working closely with you, our processing partners, to break barriers as to what is possible with optical sorting and design equipment specifically to meet your wants and needs.


    We are thrilled to announce the release of the all new TOMRA 5C, ushering in a new era of sorting for the nut and dried fruit industry!

    Processing at 95% capacity or better, 100% of the time

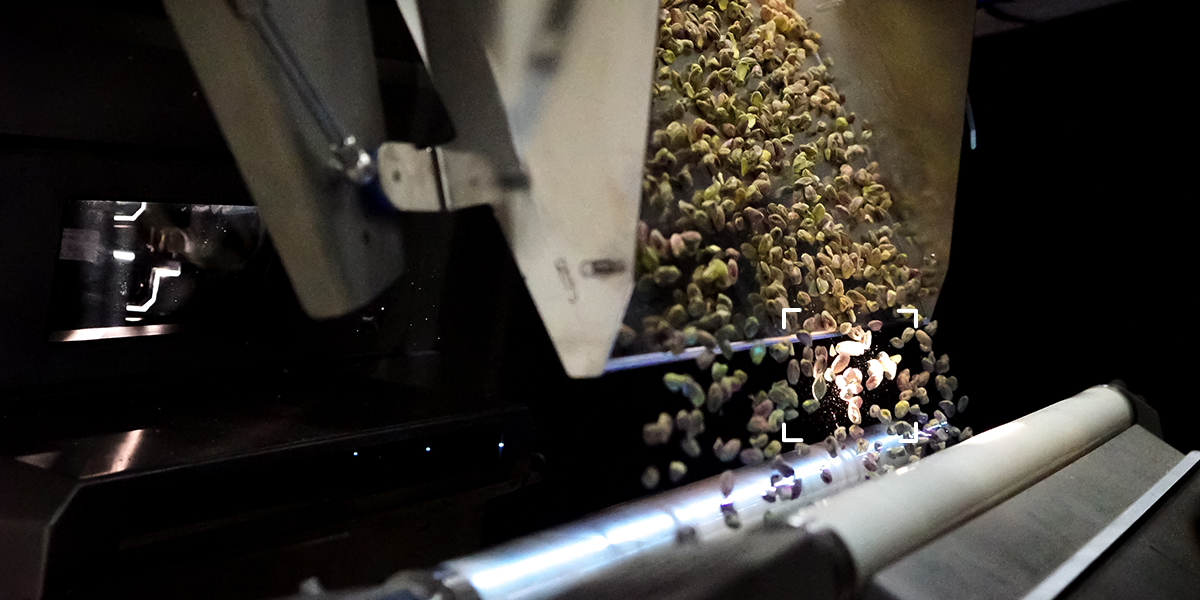
    This innovative sorter builds on the award-winning TOMRA technologies and utilizes one of the most influential forces in the universe, gravity.

    Driven by data to continuously improve your sorting capabilities, this machine will usher in the future of nuts and dried fruit sorting.


    Reduce downtime, improve yield, lower direct costs, improve operational efficiency and increase quality with vast amounts of data

    Integrated with our powerful TOMRA Insight 4.0 data platform, the TOMRA 5C has been engineered with the processor and operator in mind. Combined with an easy-to-use and intuitive display, the TOMRA 5C adapts to your needs.


    Making real-time decisions to increase profits with easy to read and actionable data has never been more straightforward

    The future of the nut and dried fruit industry is automated. The TOMRA 5C brings a level of food safety and quality that minimizes or eliminates staff required for hand sorting. We have dramatically improved capacity, doubling the throughput for almonds.


    You may have spent your entire career in the dried fruit and nut business, but we can assure you that your product has never been seen like this before.

    Speak with one of the TOMRA experts today to book your demo and take your business to the future!

  • New Resources Available on Cal/OSHA Emergency COVID-19 Regulations

    New Resources Available on Cal/OSHA Emergency COVID-19 Regulations

    Almond Alliance of California — On November 19, 2020, the California Occupational Health & Safety Standards Board unanimously adopted 21 pages of emergency Coronavirus Disease 2019 (COVID-19) safety regulations. The Regulations are broad. They apply to all employees and places of employment except: 

    • Those places of employment with one employee who does not have contact with others.
    • Employees working from home. 
    • Employees covered by Title 8 of the California Code of Regulations, Section 5199 (e.g., health care facilities, police services, labs, etc.). 
    Yesterday, the Department of Industrial Relations (DIR) released a press release specific to the Cal/OSHA Regulations to Protect Workers from COVID-19. 

    “Cal/OSHA has posted FAQs and a one-page fact sheet on the regulation, as well as a model COVID-19 prevention program. Employers are invited to participate in training webinars held by Cal/OSHA’s Consultation Services branch. Cal/OSHA will convene a stakeholder meeting in December that will include industry and labor representatives to review the requirements of the emergency regulation and solicit feedback and recommend updates. 

    While Cal/OSHA is willing to meet and work with employers during the implementation of this standard, they have provided some materials that may be helpful, which include FAQs, a fact sheet, a model COVID-19 prevention plan, training modules, and other support and consultation services to assist with compliance. They have indicated that they plan to be reasonable and flexible during implementation, meaning they will consider your good faith effort to comply and evidence of working towards compliance.

    The Office of Administrative Law (OAL) has approved the temporary emergency standards on COVID-19 workplace hazards, and the regulation is in effect now.  The Almond Alliance continues to express our members’ perspective, so please continue to send us examples of the challenges of compliance. This is critical as we advocate for revisions to the regulations. 

    The Almond Alliance intends to be part of the stakeholder meeting and will continue to engage and monitor the issue and will provide updates to members as new developments occur.  

    Employers may consider the following to prepare for these changes:
    • A thorough review of all obligations required and how they apply to your employment arrangements at each workplace.
    • HR and management training in implementation and administration.
    • A proper record of compliance.
    • Updated policies and Illness and Injury Prevention Programs.
    We are in the process of working with legal counsel to interpret these new regulations for your operation and plan to develop templates and materials for your use. Please email or call the office if you have any questions. Below is the press release from DIR that was released yesterday.
    Department of Industrial Relations News Release:
    Cal/OSHA Emergency Regulations to Protect Workers from COVID-19 in Effect

    Cal/OSHA’s emergency regulations requiring employers to protect workers from hazards related to COVID-19 are now in effect, following their approval yesterday by the Office of Administrative Law.

    “These are strong but achievable standards to protect workers. They also clarify what employers have to do to prevent workplace exposure to COVID-19 and stop outbreaks,” said Cal/OSHA Chief Doug Parker.

    The emergency standards apply to most workers in California not covered by Cal/OSHA’s Aerosol Transmissible Diseases standard. The regulations require that employers implement a site-specific written COVID-19 prevention program to address COVID-19 health hazards, correct unsafe or unhealthy conditions and provide face coverings. When there are multiple COVID-19 infections or outbreaks at the worksite, employers must provide COVID-19 testing and notify public health departments. The regulations also require accurate recordkeeping and reporting of COVID-19 cases.

    As emergency standards, these regulations become effective immediately.

    “We understand the need to educate and assist employers as they implement the new provisions of the emergency standards,” Parker noted. “For employers who need time to fully implement the regulations, enforcement investigators will take their good faith efforts to implement the emergency standards into consideration. However, aspects such as eliminating hazards and implementing testing requirements during an outbreak are essential.”

    Cal/OSHA has posted FAQs and a one-page fact sheet on the regulation, as well as a model COVID-19 prevention program. Employers are invited to participate in training webinars held by Cal/OSHA’s Consultation Services branch.

    Cal/OSHA will convene a stakeholder meeting in December that will include industry and labor representatives to review the requirements of the emergency regulation and solicit feedback and recommend updates.

    Cal/OSHA helps protect workers from health and safety hazards on the job in almost every workplace in California. Employers and workers who have questions or need assistance with workplace health and safety programs can call Cal/OSHA’s Consultation Services Branch at 800-963-9424.


    Complaints about workplace safety and health hazards can be filed confidentially with Cal/OSHA district offices.

  • Assessing the Costs & Benefits of Winter Cover Cropping in CA

    Assessing the Costs & Benefits of Winter Cover Cropping in CA

    Winter cover cropping is a promising agricultural management practice that boosts soil health. This article discusses a benefit-cost analysis of winter cover crop adoption and introduces a web-based interactive calculator for farmers to assess changes to baseline farm profits.

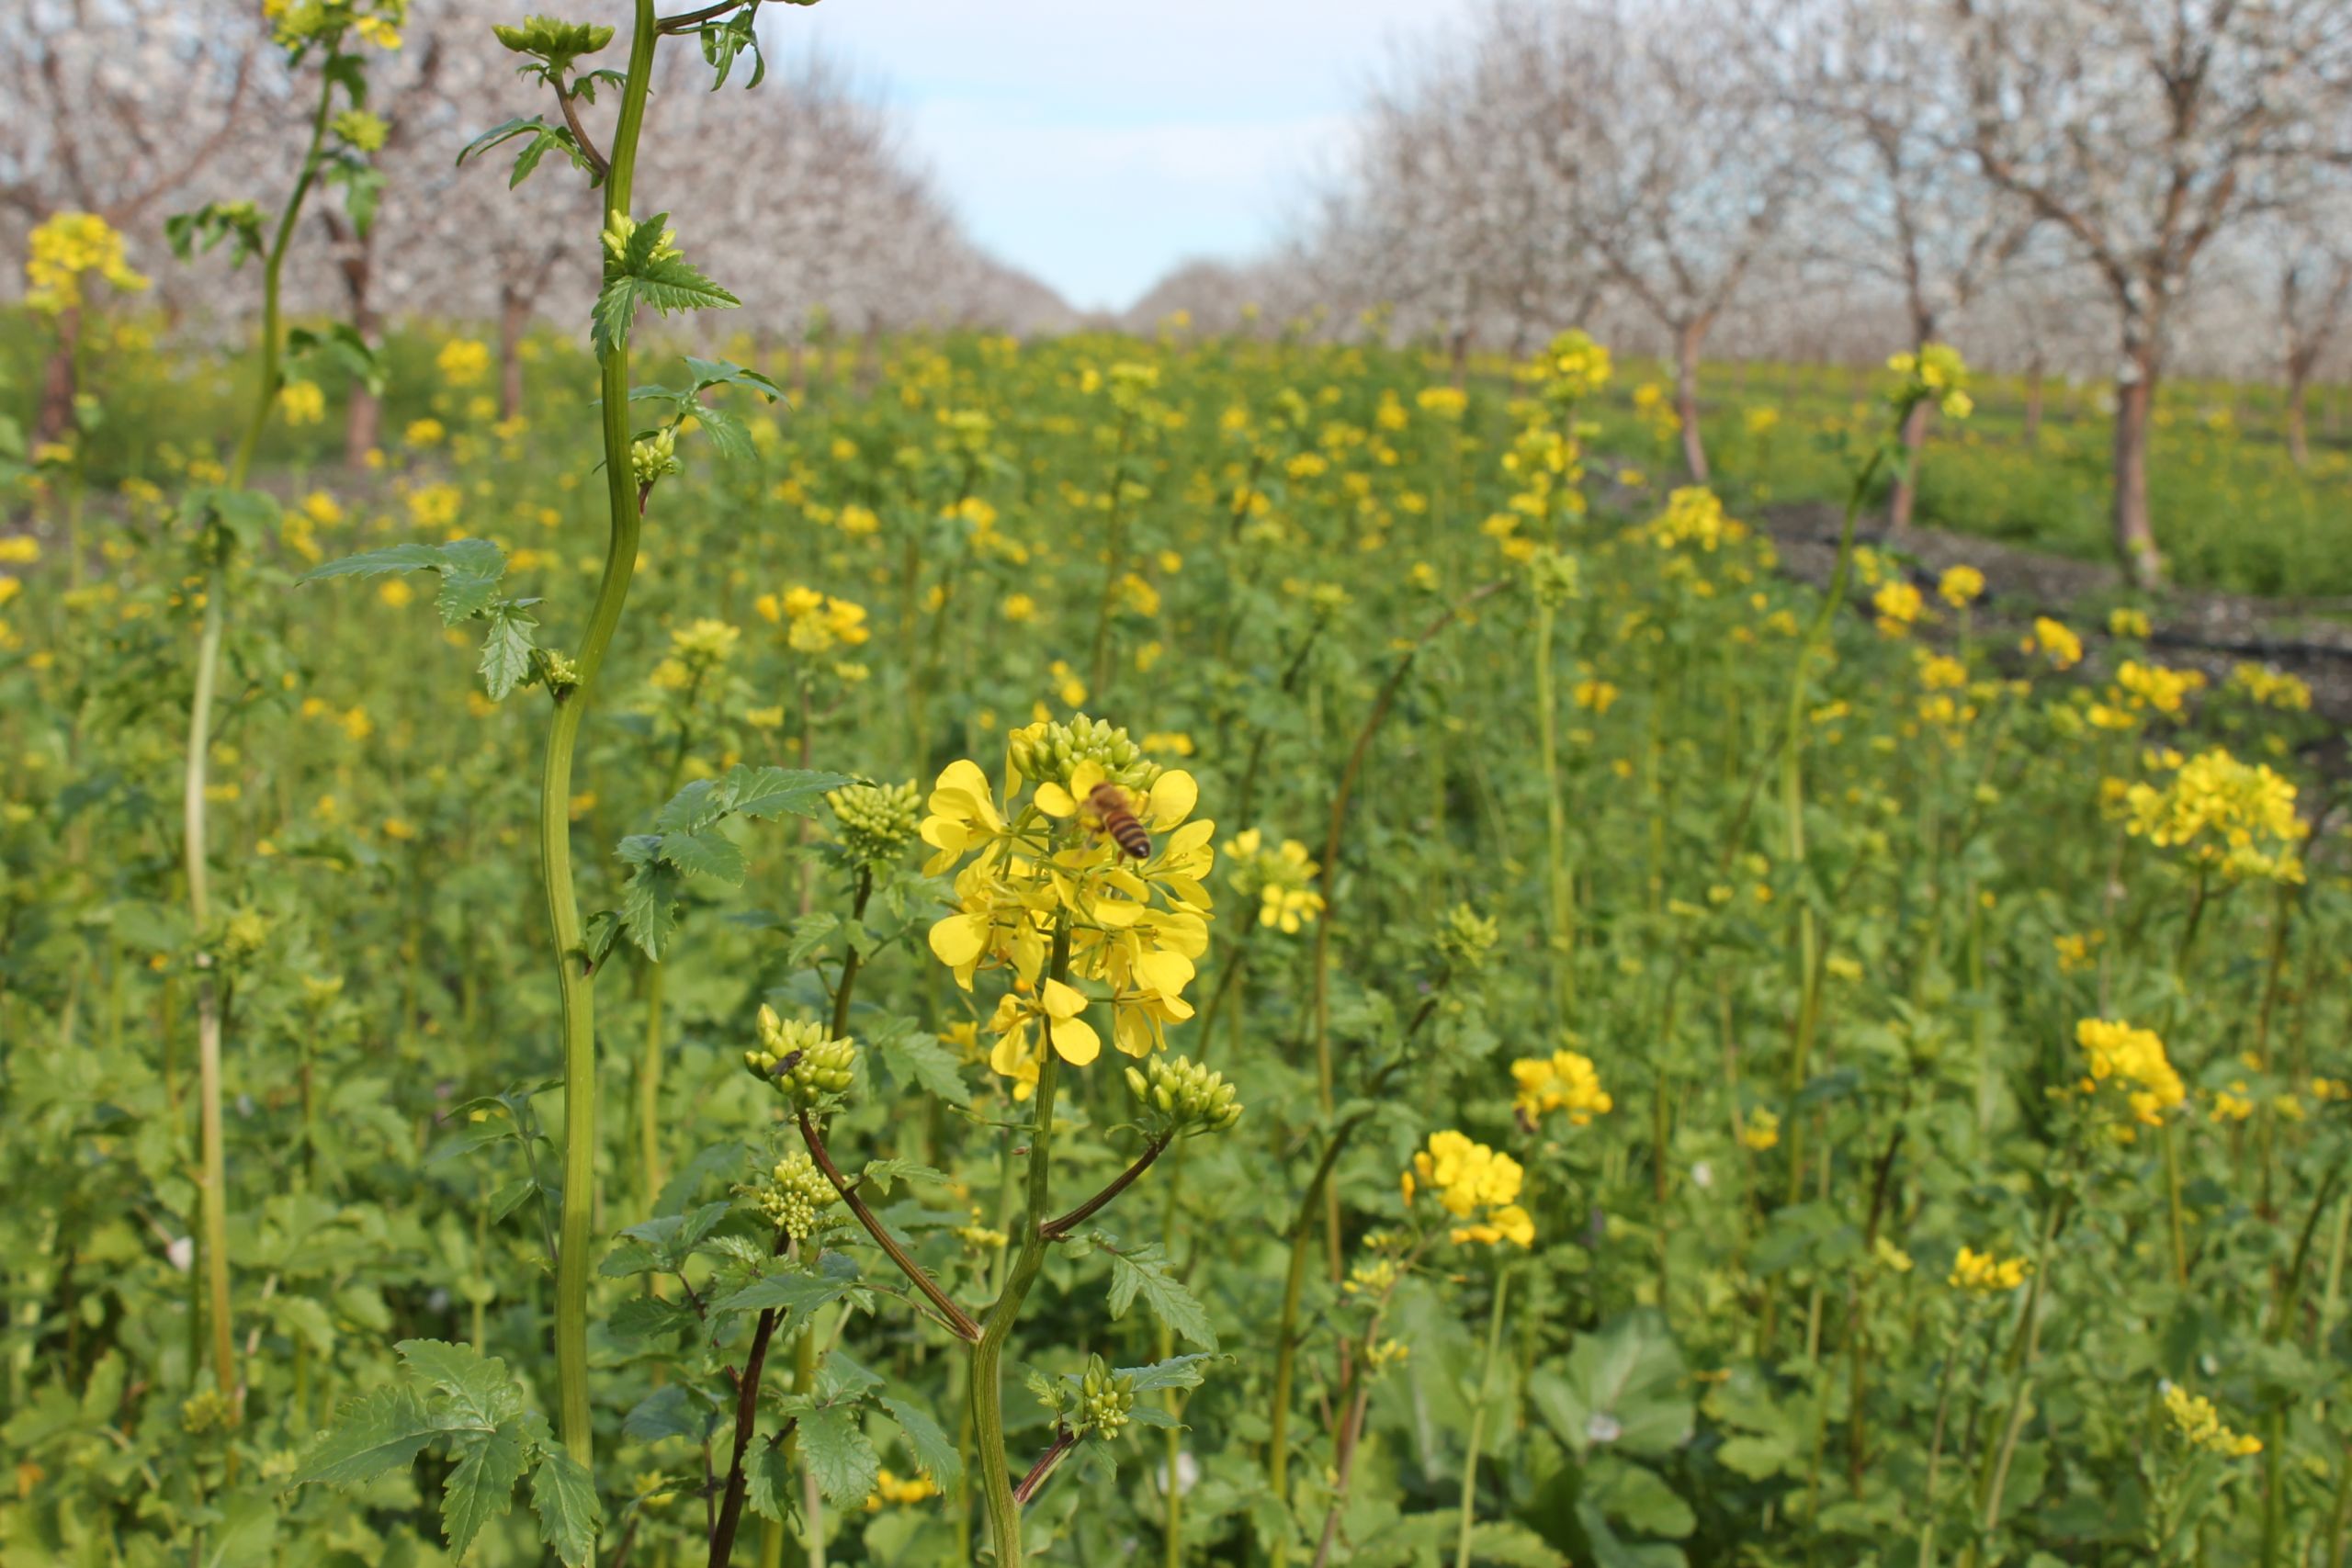
    Winter cover cropping is an agricultural management practice that can enhance soil health while protecting fields from soil erosion and compaction. Cover crops are typically grown on farmland that would otherwise be left fallow in the wintertime, such as fields used for annual spring-summer crops, or in between rows of trees or vines, and thus do not replace a cash crop. Despite its well-known soil health and ecological benefits, and popularity in other parts of the U.S., winter cover crop adoption rates are low across California’s specialty crops. To better understand drivers and incentives for adoption, we created a benefit-cost calculator that estimates how baseline profits change as a farmer integrates winter cover cropping.

    This tool was designed for specialty-crop farmers who are interested in growing winter cover crops and want to understand how long it will take for that investment to break even. However, the tool is useful for anyone interested in better understanding the financial implications of cover cropping. In this article, we explain the methodology behind the tool and how to use it.

    Methodology

    We developed a calculator that estimates the expected changes in expenses and revenues associated with the introduction of winter cover cropping for a given farming operation. We started by modeling the implications of winter cover crops to average farms that grow processing tomatoes and almonds, two of California’s most important agricultural commodities. The model estimates a benefit-cost ratio in present value terms, i.e., the ratio of the sum of benefits over the sum of costs accumulated over time and discounted to the present.

    In our baseline analysis, we considered cover crop seed mixes that are commonly used for winter cover cropping in California’s Central Valley. For tomato operations, this was assumed to be a small grain forage mix (e.g., bell beans, winter peas, common vetch) and for almonds, this was assumed to be a more expensive clover mix.

    Table 1 lists potential benefits and costs of winter cover cropping. Benefits and costs are not the same every year. The monetary values for each of these components are incorporated into the model at the specific time when that benefit or cost is likely to be experienced.

    Benefits include increased income from greater yields, which results from improvements in soil quality, fertility, and soil-water relations due to cover cropping. Benefits also include reductions in expenses associated with soil erosion control, nutrient cycling, weed control, mycorrhizal fungi colonization, and reduced tillage operations. Almond growers may also benefit from lower beehive prices.

    The potential for cover crops to affect the irrigation requirements of cash crops is debated in the scientific literature. Cover crops may lead to higher water infiltration (resulting from improved porosity of the top soil), which can lead to increased capture of winter and spring rainfall, increased soil-water storage, which in turn can delay irrigation start and eventually reduce spring/summer irrigation requirements slightly; however, these effects are soil-specific and difficult to quantify and generalize and, thus, are not included in the baseline model. Other potentially valuable aspects of cover cropping that were not explicitly accounted for in the analysis include reduced soil sealing and compaction, better soil oxygen concentration and diffusion rates, as well as increased effectiveness of salt-leaching practices.

    Furthermore, while cover cropping has been shown to improve ecosystem services and downstream user benefits, these are not included in the baseline benefit-cost calculations. These societal benefits, which include increased soil organic matter, the protection of downstream surface water quality via reduced runoff, and carbon sequestration through enhanced soil-carbon storage, were not included because they would not accrue as a revenue flow to the farmer choosing to adopt.

    Costs include the initial expenses associated with cover crop seeds, planting, and termination, depreciation of machinery used for this management practice, and time spent learning how to incorporate cover crops into an operation, as well as disseminating new instructions to crewmembers. The model accounts for financial losses due to potential harvest complications with cash crops. For example, a heavy rain at the end of March could delay termination of cover crops, and thus delay the planting of tomato seedlings, which can postpone the timing of tomato harvest. This poses a potential complication for farmers who contract with tomato canneries, resulting in penalties.

    To quantify these benefits and costs, we collected data from UC Ag Issues Center’s Cost and Return Studies, scientific publications, semi-structured farmer interviews, and field experiments to establish an average value of each benefit and cost component. We then aggregated these components to estimate benefit-cost ratios for tomato and almond production systems, where a value of the ratio greater than 1 indicates a net positive change in profits. The interactive calculator is seeded with the average value for each benefit and cost component, but can be adjusted by the user to reflect a specific farming operation. While our model attempts to be as comprehensive as possible, some potential benefits or costs are not included, such as interactions with pruning or other practices.

    Results

    When using average values for all the benefit and cost components, we find that almond systems have a benefit-cost ratio greater than 1 when considering a 30-year time horizon, meaning that benefits are likely to exceed costs on average. When using average values for the tomato system, we find the benefit-cost ratio to be less than 1, given their assumed 10-year time horizon. The time horizons of 10 and 30 years were chosen for tomato and almond operations, respectively, to reflect typical rotation patterns and crop life cycles. Figure 1 displays these results year-over-year. At the 10-year mark for tomatoes and the 30-year mark for almonds, the average benefit-cost ratios are 0.5 and 1.3, respectively, indicating that total benefits eventually outweigh total costs for almond operations, but not tomatoes.

    Winter cover cropping is an investment in the long-term viability of agricultural operations. The benefits and costs accrue differently over time and may vary from year to year. Harvest complications with a cash crop reduce profitability but can be avoided with flexible contractual obligations or by growing a cover crop with predictable senescence. Overall, our results show the value of this soil management practice is greatest for California farmers with a longer time horizon and willingness to manage a cover crop as carefully as their cash crop.

    Interactive Web-based Calculator

    The web-based cover crop calculator, partially shown in Figure 2 and available here, is an interactive decision-support tool that calculates the benefits and costs of winter cover cropping in almond and processing tomato operations. The tool estimates how much farmers can expect their profits to change after growing winter cover crops for a certain number of years. All values used in the calculator are flexible and can be adjusted to match the reality on any commercial farm. The calculator is seeded with the average values for each cost and benefit component that we considered, but the user can easily adjust or remove any component.

    The calculator assumes continuous cover cropping after the year of adoption (first year), and that all benefits of cover crops begin accruing within the first five years. Importantly, the tool may not capture every potential benefit and cost from introducing cover crops into a farming operation. It simply serves as a guide to when a farm can expect to experience economic returns, based on the monetized benefits and costs.

    As mentioned previously, cover crops could either increase or decrease spring-summer irrigation requirements. Although this component is not included in the baseline net present value model, the calculator is flexible in this variable. The user can specify the extent to which cover crops increase or decrease irrigation requirements in the growing season and can add irrigation costs to germinate the crop if needed, and then observe how their baseline profits shift accordingly. Users can also explore how a financial incentive, in the form of an annual subsidy payment per acre of cover-cropped farmland, will affect their outcomes. The calculator allows one to value the social benefits of cover cropping (ecosystem services, carbon sequestration, and downstream water quality) via this subsidy component. – By Ellen Bruno, Alyssa DeVincentis, Samuel Sandoval Solis, and Daniele Zaccaria, UC Giannini Foundation of Agricultural Economics, University of California

    Authors’ Bios

    Ellen Bruno is an assistant Cooperative Extension specialist in the ARE department at UC Berkeley. Alyssa DeVincentis is a Ph.D graduate from UC Davis in Hydrologic Sciences. Samuel Sandoval Solis is an associate professor and Cooperative Extension specialist and Daniele Zaccaria is an associate Cooperative Extension specialist, both in the Department of Land, Air and Water Resources at UC Davis. They can be reached at ebruno@berkeley.edu, ajdevincentis@ucdavis.edu, samsandoval@ucdavis.edu, and dzaccaria@ucdavis.edu, respectively. 

  • Tree Nuts Market Research and Outlook, 2020 – 2026

    Tree Nuts Market Research and Outlook, 2020 – 2026

    Tree Nuts market trends, outlook, growth opportunities and companies to 2025 presents analysis and outlook of Tree Nuts types, end user industries and countries. The global F&B market witnessed significant growth over the past decade. The report presents key trends in the Tree Nuts market and provides an overview of global and regional markets, market size forecasts, drivers and challenges across markets.

    The Tree Nuts market has been one of the rapidly recovering industries from the harsh COVID market conditions in 2020. The long-term outlook for Tree Nuts market size remains robust as companies emphasize investments in new product launches and process optimization.

    COVID-19 impact on the Tree Nuts industry

    Tree Nuts companies are strategizing focused R&D investments and planning new product launches post- COVID conditions from 2021. Further, strengthening relations with distributors, performance improvement, and cost optimization are largely observed strategies during 2020.

    Tree Nuts industry outlook and post COVID-19 pandemic opportunities:

    The report presents forecasts for Tree Nuts market revenue over the next six years from 2020 to 2026 across coronavirus spread conditions:

    • Pre-COVID Tree Nuts market scenario: Economic growth continues as usual without the impact of COVID
    • Post-COVID impact scenario: Economic recovery will begin from mid-2021 and the economy faces recession and weak supply-demand conditions

    Growth Opportunities, Market Risks, and Strategy Analysis:

    The report details strategic growth opportunities, potential market drivers, and risks in global and country-level Tree Nuts markets from 2020 to 2026. Key strategies being opted by leading manufacturers, suppliers, distribution companies, and other players in the near-term and long-term future. Potential market risks, emerging trends, and top-level strategies are included in the report.

    Segment growth outlook of Tree Nuts across markets

    The market analysis report presents the potential growth opportunities across types and applications of Tree Nuts industry size. The report models the long-term impact of new product developments, shifting consumer patterns, and swiftly changing industry dynamics on different Tree Nuts types and Tree Nuts end-user applications.

    Strategic analysis of leading Tree Nuts companies

    To make better planning decisions by suppliers and other food and beverage industry stakeholders, the report presents the strategic analysis of leading Tree Nuts companies. Opportunities in emerging markets, product launches, and technology trends are analyzed in the report.

    Tree Nuts market size forecast across 15 countries

    The US, Canada, Germany, the UK, France, Spain, China, India, Japan, Republic of Korea, Brazil, Argentina, Saudi Arabia, and other countries across North America, Latin America, Europe, Middle East Africa, and Asia Pacific are included in the report. The outlook for Tree Nuts market size growth is provided for each of the countries from 2020 to 2026.

    Tree Nuts market news and developments:

    Tree Nuts market developments including technological developments, mergers and acquisitions, product launches, business expansions, investments, new plants, and others are included in the report.


    Scope of the Study:

    • Tree Nuts Market revenue forecasts across three post-COVID pandemic case scenarios, 2020- 2026
    • Global Tree Nuts market size outlook by type, 2020- 2026
    • Global Tree Nuts market size outlook by application segment, 2020- 2026
    • Global Tree Nuts market outlook across 15 emerging and developed countries, 2020- 2026
    • Strategies, Trends, Drivers, and Risks facing Tree Nuts companies
    • Company profiles of leading five players in Tree Nuts industry
    • Market News and Developments

    This report provides insight into:

    • Understanding the impact of market conditions on the future of Tree Nuts across segments and markets
    • Developing longer-term strategies to improve customer engagement and market shares
    • Prioritizing short-term R&D and CAPEX allocations to ensure high profitability
    • Identifying key trends and market opportunities
    • Boosting revenues from existing and new consumer markets

    Methodology:

    The comprehensive and trusted guide for anyone seeking information on this industry is developed using primary interviews with suppliers, annual reports of companies, filings, news podcasts, outlook statements, statistical organizations, directories, databases, investor presentations, white papers, and others. Both top-down and bottom-up approaches are used to ensure the accuracy of forecasts.

    Why Choose this Report- APES

    A: Authored by a team of 7 analysts, headed by a manager with 14+ years of industry experience
    P: Print authentication given for single-user license
    E: Excel sheet will be provided for ease of analysis across scenarios
    S: Strategy consulting and research support will be provided for three months

     
    Purchase the full report HERE.
  • Industry Input Needed: Aluminum Phosphide, Magnesium Phosphide & Phosphine Proposed US EPA Interim Registration Review Decision

    Industry Input Needed: Aluminum Phosphide, Magnesium Phosphide & Phosphine Proposed US EPA Interim Registration Review Decision

    In September of 2020, the US EPA released their Proposed Interim Registration Review Decision on Aluminum Phosphide, Magnesium Phosphide, and Phosphine. There is a 60-day comment period on this decision with a deadline of Tuesday, December 22, 2020.

    In the review, the EPA has proposed mandatory buffer zones based on computer modeling. The proposed actions for phosphine and the metal phosphides would establish mandatory buffer zones around fumigation facilities into which bystanders may not enter during treatment or aeration of commodities post treatment. EPA is proposing a minimum of 10 feet for all fumigations and proposed buffers of 10 feet to 500 feet depending on application rate, facility, container size and other impacts of the fumigation procedures. These buffer zones could restrict your current uses of phosphine drastically, some to the point where you may no longer be able to use the fumigant.

    How does this impact the almond industry?  This decision impacts almonds, barley, grains, avocados, corn, cotton, lettuce, peanuts, pistachios, rice and more. Phosphine is a colorless gas used on commodities in storage and shipping to prevent losses due to insect and vertebrate (mainly rodent) pests. Phosphine is formulated as a pressurized gas stored in cylinders. It is the active component of the metal phosphides, released when pellets of metal phosphide interact with moisture in the air. Phosphine and metal phosphide products are registered for use on dried foods (e.g.: nuts, dried fruits, grains), on animal feed, and on processed foods (e.g.: candy, baking mixes, crackers, meats, dairy). Phosphine gas products are registered for use on non-food commodities, such as tobacco, clothing fibers, hair, wood, paper, tires, and beehives. Metal phosphide products are also registered for in-field (i.e.: greater than 100 feet from occupied buildings), in-burrow rodent control. Phosphine and the metal phosphides are applied as structural or space fumigants (e.g.: under tarps, in grain mills, in warehouses), vehicle fumigants (e.g.: railcars, trucks, containers), grain fumigants (e.g.: silos, farm storage, flat storage), and vessel/ship fumigants.

    Data from California for the years 2013 to 2017 indicate that an average of 19,900 lbs phosphine, 160,600 lbs aluminum phosphide, and 13,200 lbs magnesium phosphide were applied annually in California. The applications for all three active ingredients (a.i.s) were made to nuts (6,900 lbs phosphine, 50,200 lbs aluminum phosphide, and 67,000 lbs magnesium phosphide). Structural use including storage facilities and processing equipment (14,900 lbs aluminum phosphide, 300 lbs magnesium phosphide) was also reported. The remaining usage data do not specify a specific commodity. Similar records of usage data are not required by other states and are not available.

    Please take the time to read the below attachments and click the link to fill out the questionnaire which was developed by the manufacturer Degesch. This questionnaire should only take a few minutes to complete but is extremely valuable in responding to public comments and advocating on behalf of the industry. Time is of the essence, so we are asking for your assistance by November 30th.

    Questionnaire: Click Here.

    EPA Proposed Interim Registration Review Letter: Click Here.

    Proposed Interim Registration Review Decision Case Document: Click Here.

    Again, the industry has a deadline of December 22, 2020, to respond to the PID. Please complete your responses to the questionnaire by Monday, November 30, 2020.

    Feel free to distribute this link within your organization or to others who may be able to provide feedback on the PID proposals.

    If you have any questions, please call, Elaine Trevino at 209-300-7140 or Ed Hosoda at Cardinal Professional Products at 916-997-6045.

    For additional information please go to the EPA website at the following link: http://www.epa.gov/pesticide-reevaluation.

  • $12 Million to Eradicate an Invasive Rodent of Unusual Size

    $12 Million to Eradicate an Invasive Rodent of Unusual Size

    You may have heard of them in the comedy film Princess Bride as “Rodents of Unusual Size”, but this is the real thing — only not so large and formidable.  Nutria were originally introduced into the United States as part of the fur trade in the late 1800s, but were eradicated from California in the 1970s.  They made a sudden reappearance a few years ago, and are a great threat to our water infrastructure, indigenous wildlife, and even certain crops. Watch this brief interview with Brian Popper from USDA-APHIS Wildlife Services, who spoke about a number of wildlife pests at Malcolm Media’s annual Tree & Vine Expo recently.
     
    Please thank this video’s sponsor Suterra for their industry support.