Category: Non-Video

  • New Resources Available on Cal/OSHA Emergency COVID-19 Regulations

    New Resources Available on Cal/OSHA Emergency COVID-19 Regulations

    Almond Alliance of California — On November 19, 2020, the California Occupational Health & Safety Standards Board unanimously adopted 21 pages of emergency Coronavirus Disease 2019 (COVID-19) safety regulations. The Regulations are broad. They apply to all employees and places of employment except: 

    • Those places of employment with one employee who does not have contact with others.
    • Employees working from home. 
    • Employees covered by Title 8 of the California Code of Regulations, Section 5199 (e.g., health care facilities, police services, labs, etc.). 
    Yesterday, the Department of Industrial Relations (DIR) released a press release specific to the Cal/OSHA Regulations to Protect Workers from COVID-19. 

    “Cal/OSHA has posted FAQs and a one-page fact sheet on the regulation, as well as a model COVID-19 prevention program. Employers are invited to participate in training webinars held by Cal/OSHA’s Consultation Services branch. Cal/OSHA will convene a stakeholder meeting in December that will include industry and labor representatives to review the requirements of the emergency regulation and solicit feedback and recommend updates. 

    While Cal/OSHA is willing to meet and work with employers during the implementation of this standard, they have provided some materials that may be helpful, which include FAQs, a fact sheet, a model COVID-19 prevention plan, training modules, and other support and consultation services to assist with compliance. They have indicated that they plan to be reasonable and flexible during implementation, meaning they will consider your good faith effort to comply and evidence of working towards compliance.

    The Office of Administrative Law (OAL) has approved the temporary emergency standards on COVID-19 workplace hazards, and the regulation is in effect now.  The Almond Alliance continues to express our members’ perspective, so please continue to send us examples of the challenges of compliance. This is critical as we advocate for revisions to the regulations. 

    The Almond Alliance intends to be part of the stakeholder meeting and will continue to engage and monitor the issue and will provide updates to members as new developments occur.  

    Employers may consider the following to prepare for these changes:
    • A thorough review of all obligations required and how they apply to your employment arrangements at each workplace.
    • HR and management training in implementation and administration.
    • A proper record of compliance.
    • Updated policies and Illness and Injury Prevention Programs.
    We are in the process of working with legal counsel to interpret these new regulations for your operation and plan to develop templates and materials for your use. Please email or call the office if you have any questions. Below is the press release from DIR that was released yesterday.
    Department of Industrial Relations News Release:
    Cal/OSHA Emergency Regulations to Protect Workers from COVID-19 in Effect

    Cal/OSHA’s emergency regulations requiring employers to protect workers from hazards related to COVID-19 are now in effect, following their approval yesterday by the Office of Administrative Law.

    “These are strong but achievable standards to protect workers. They also clarify what employers have to do to prevent workplace exposure to COVID-19 and stop outbreaks,” said Cal/OSHA Chief Doug Parker.

    The emergency standards apply to most workers in California not covered by Cal/OSHA’s Aerosol Transmissible Diseases standard. The regulations require that employers implement a site-specific written COVID-19 prevention program to address COVID-19 health hazards, correct unsafe or unhealthy conditions and provide face coverings. When there are multiple COVID-19 infections or outbreaks at the worksite, employers must provide COVID-19 testing and notify public health departments. The regulations also require accurate recordkeeping and reporting of COVID-19 cases.

    As emergency standards, these regulations become effective immediately.

    “We understand the need to educate and assist employers as they implement the new provisions of the emergency standards,” Parker noted. “For employers who need time to fully implement the regulations, enforcement investigators will take their good faith efforts to implement the emergency standards into consideration. However, aspects such as eliminating hazards and implementing testing requirements during an outbreak are essential.”

    Cal/OSHA has posted FAQs and a one-page fact sheet on the regulation, as well as a model COVID-19 prevention program. Employers are invited to participate in training webinars held by Cal/OSHA’s Consultation Services branch.

    Cal/OSHA will convene a stakeholder meeting in December that will include industry and labor representatives to review the requirements of the emergency regulation and solicit feedback and recommend updates.

    Cal/OSHA helps protect workers from health and safety hazards on the job in almost every workplace in California. Employers and workers who have questions or need assistance with workplace health and safety programs can call Cal/OSHA’s Consultation Services Branch at 800-963-9424.


    Complaints about workplace safety and health hazards can be filed confidentially with Cal/OSHA district offices.

  • Assessing the Costs & Benefits of Winter Cover Cropping in CA

    Assessing the Costs & Benefits of Winter Cover Cropping in CA

    Winter cover cropping is a promising agricultural management practice that boosts soil health. This article discusses a benefit-cost analysis of winter cover crop adoption and introduces a web-based interactive calculator for farmers to assess changes to baseline farm profits.

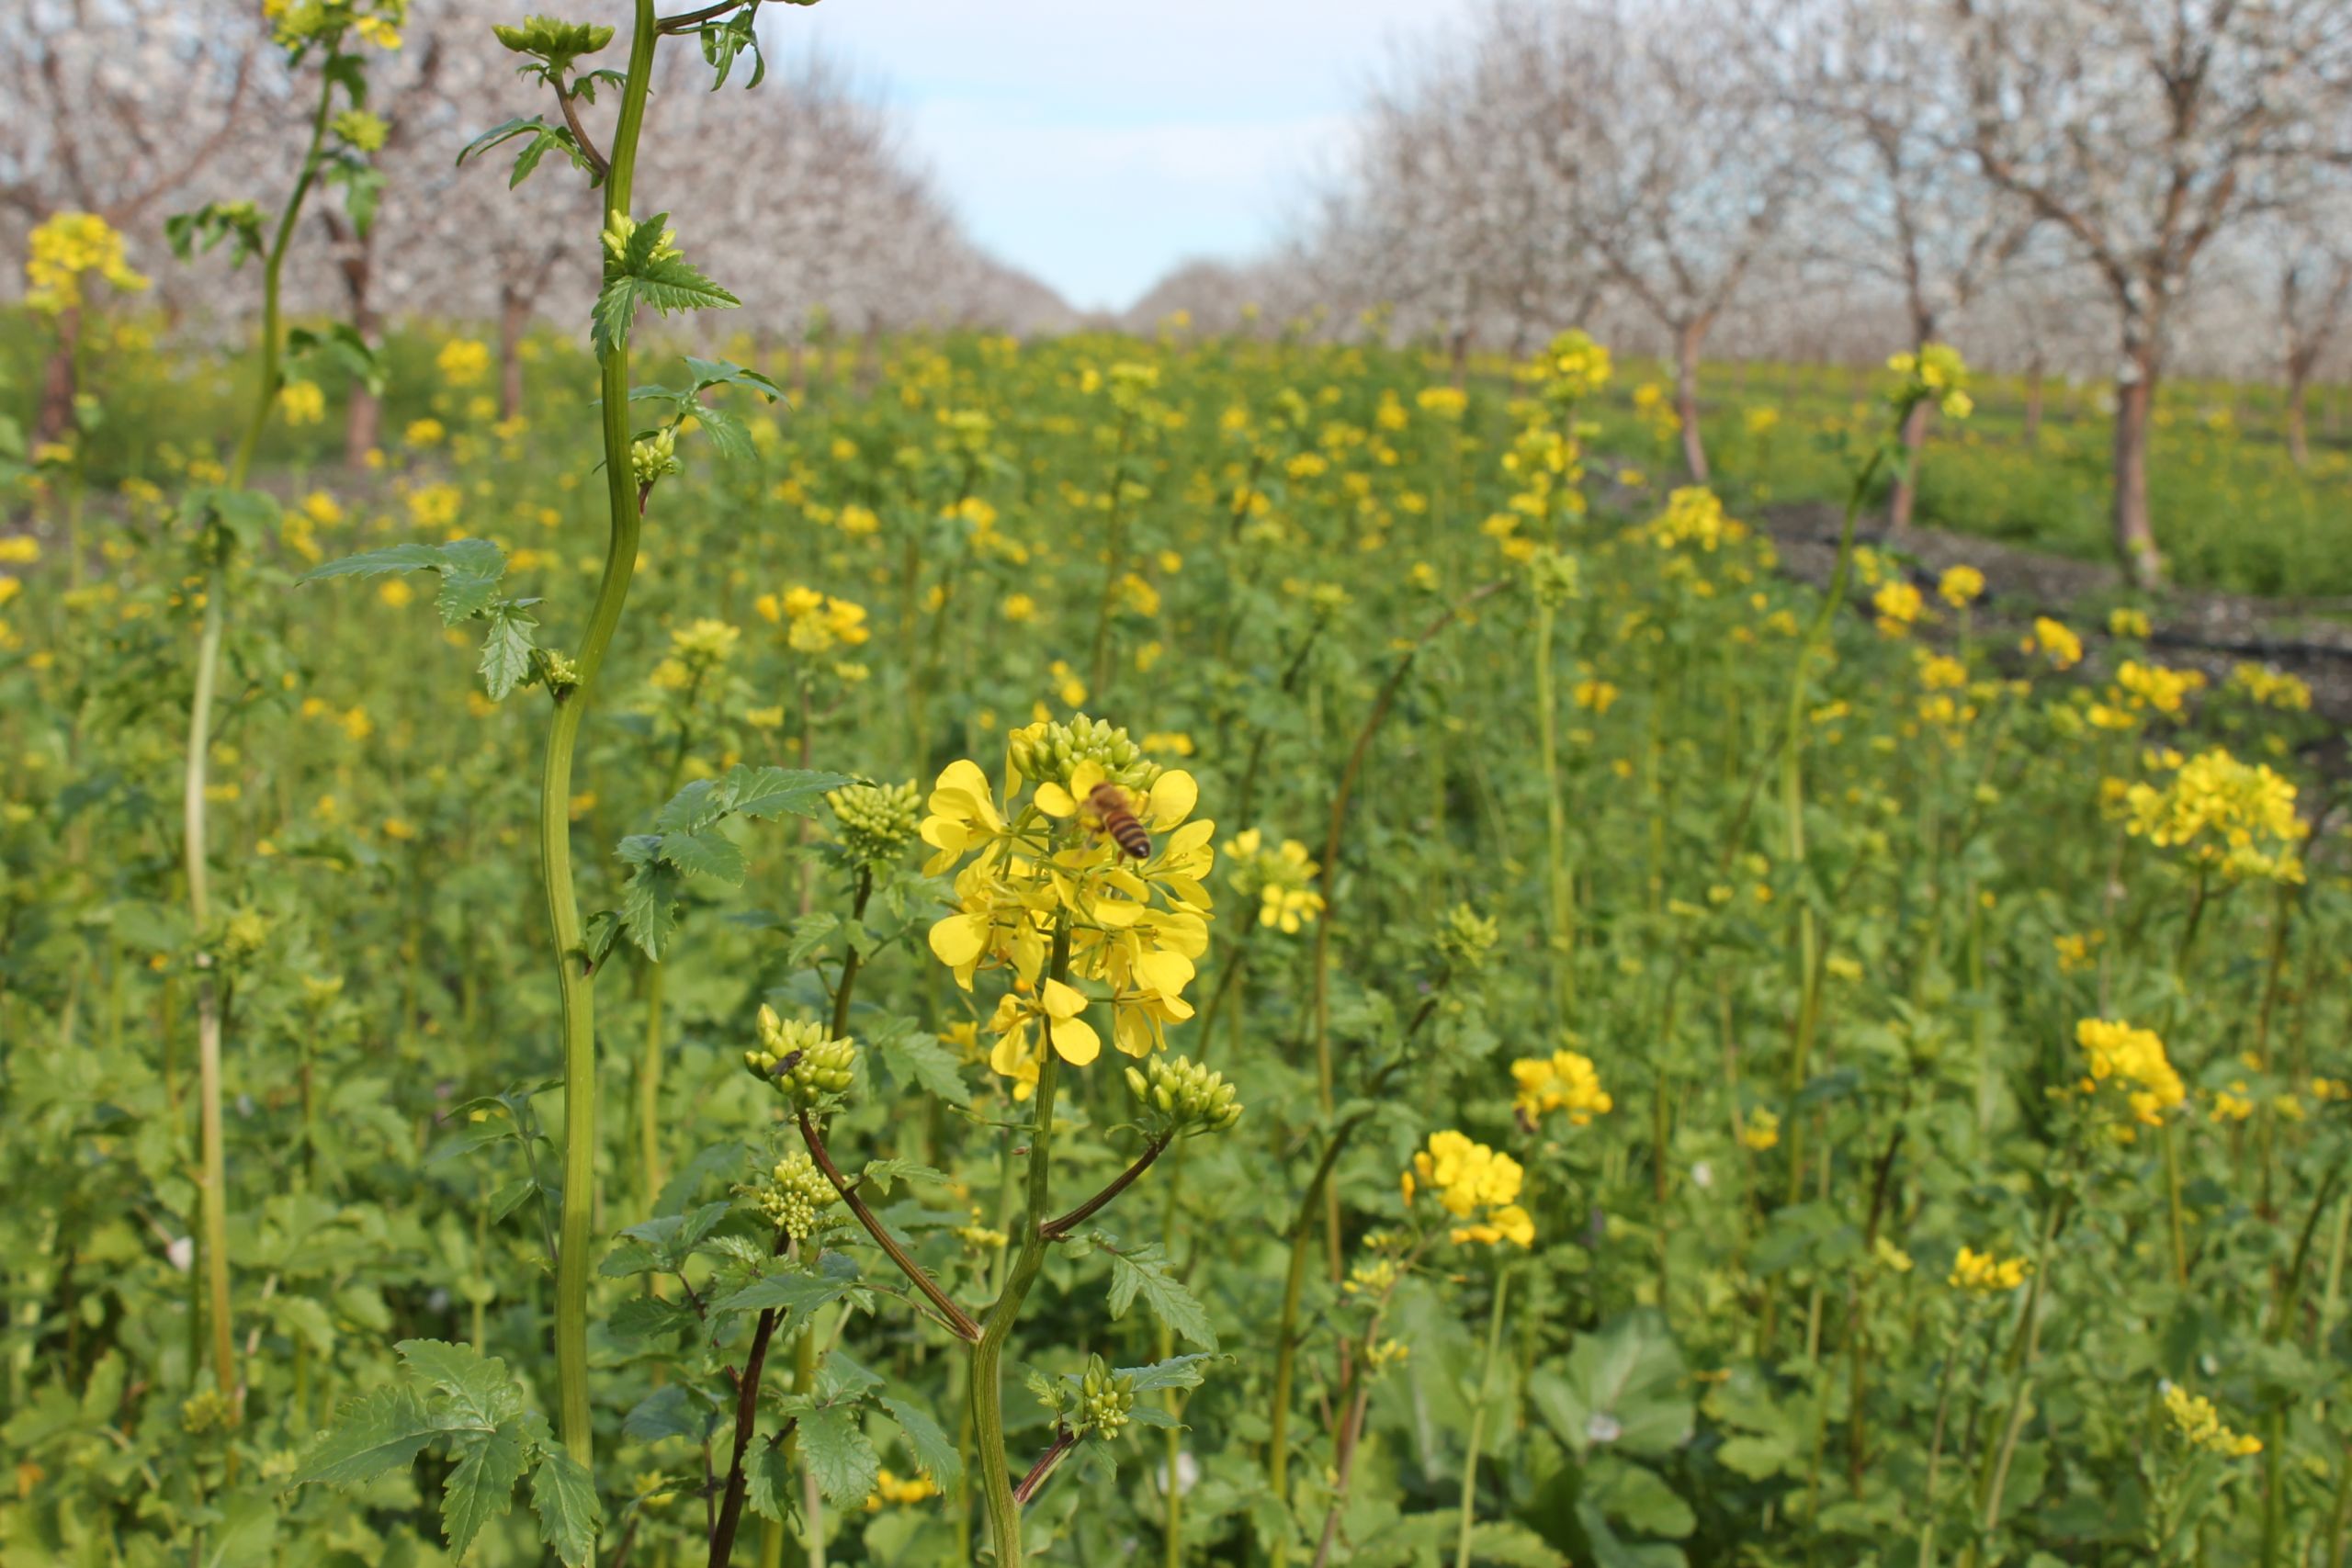
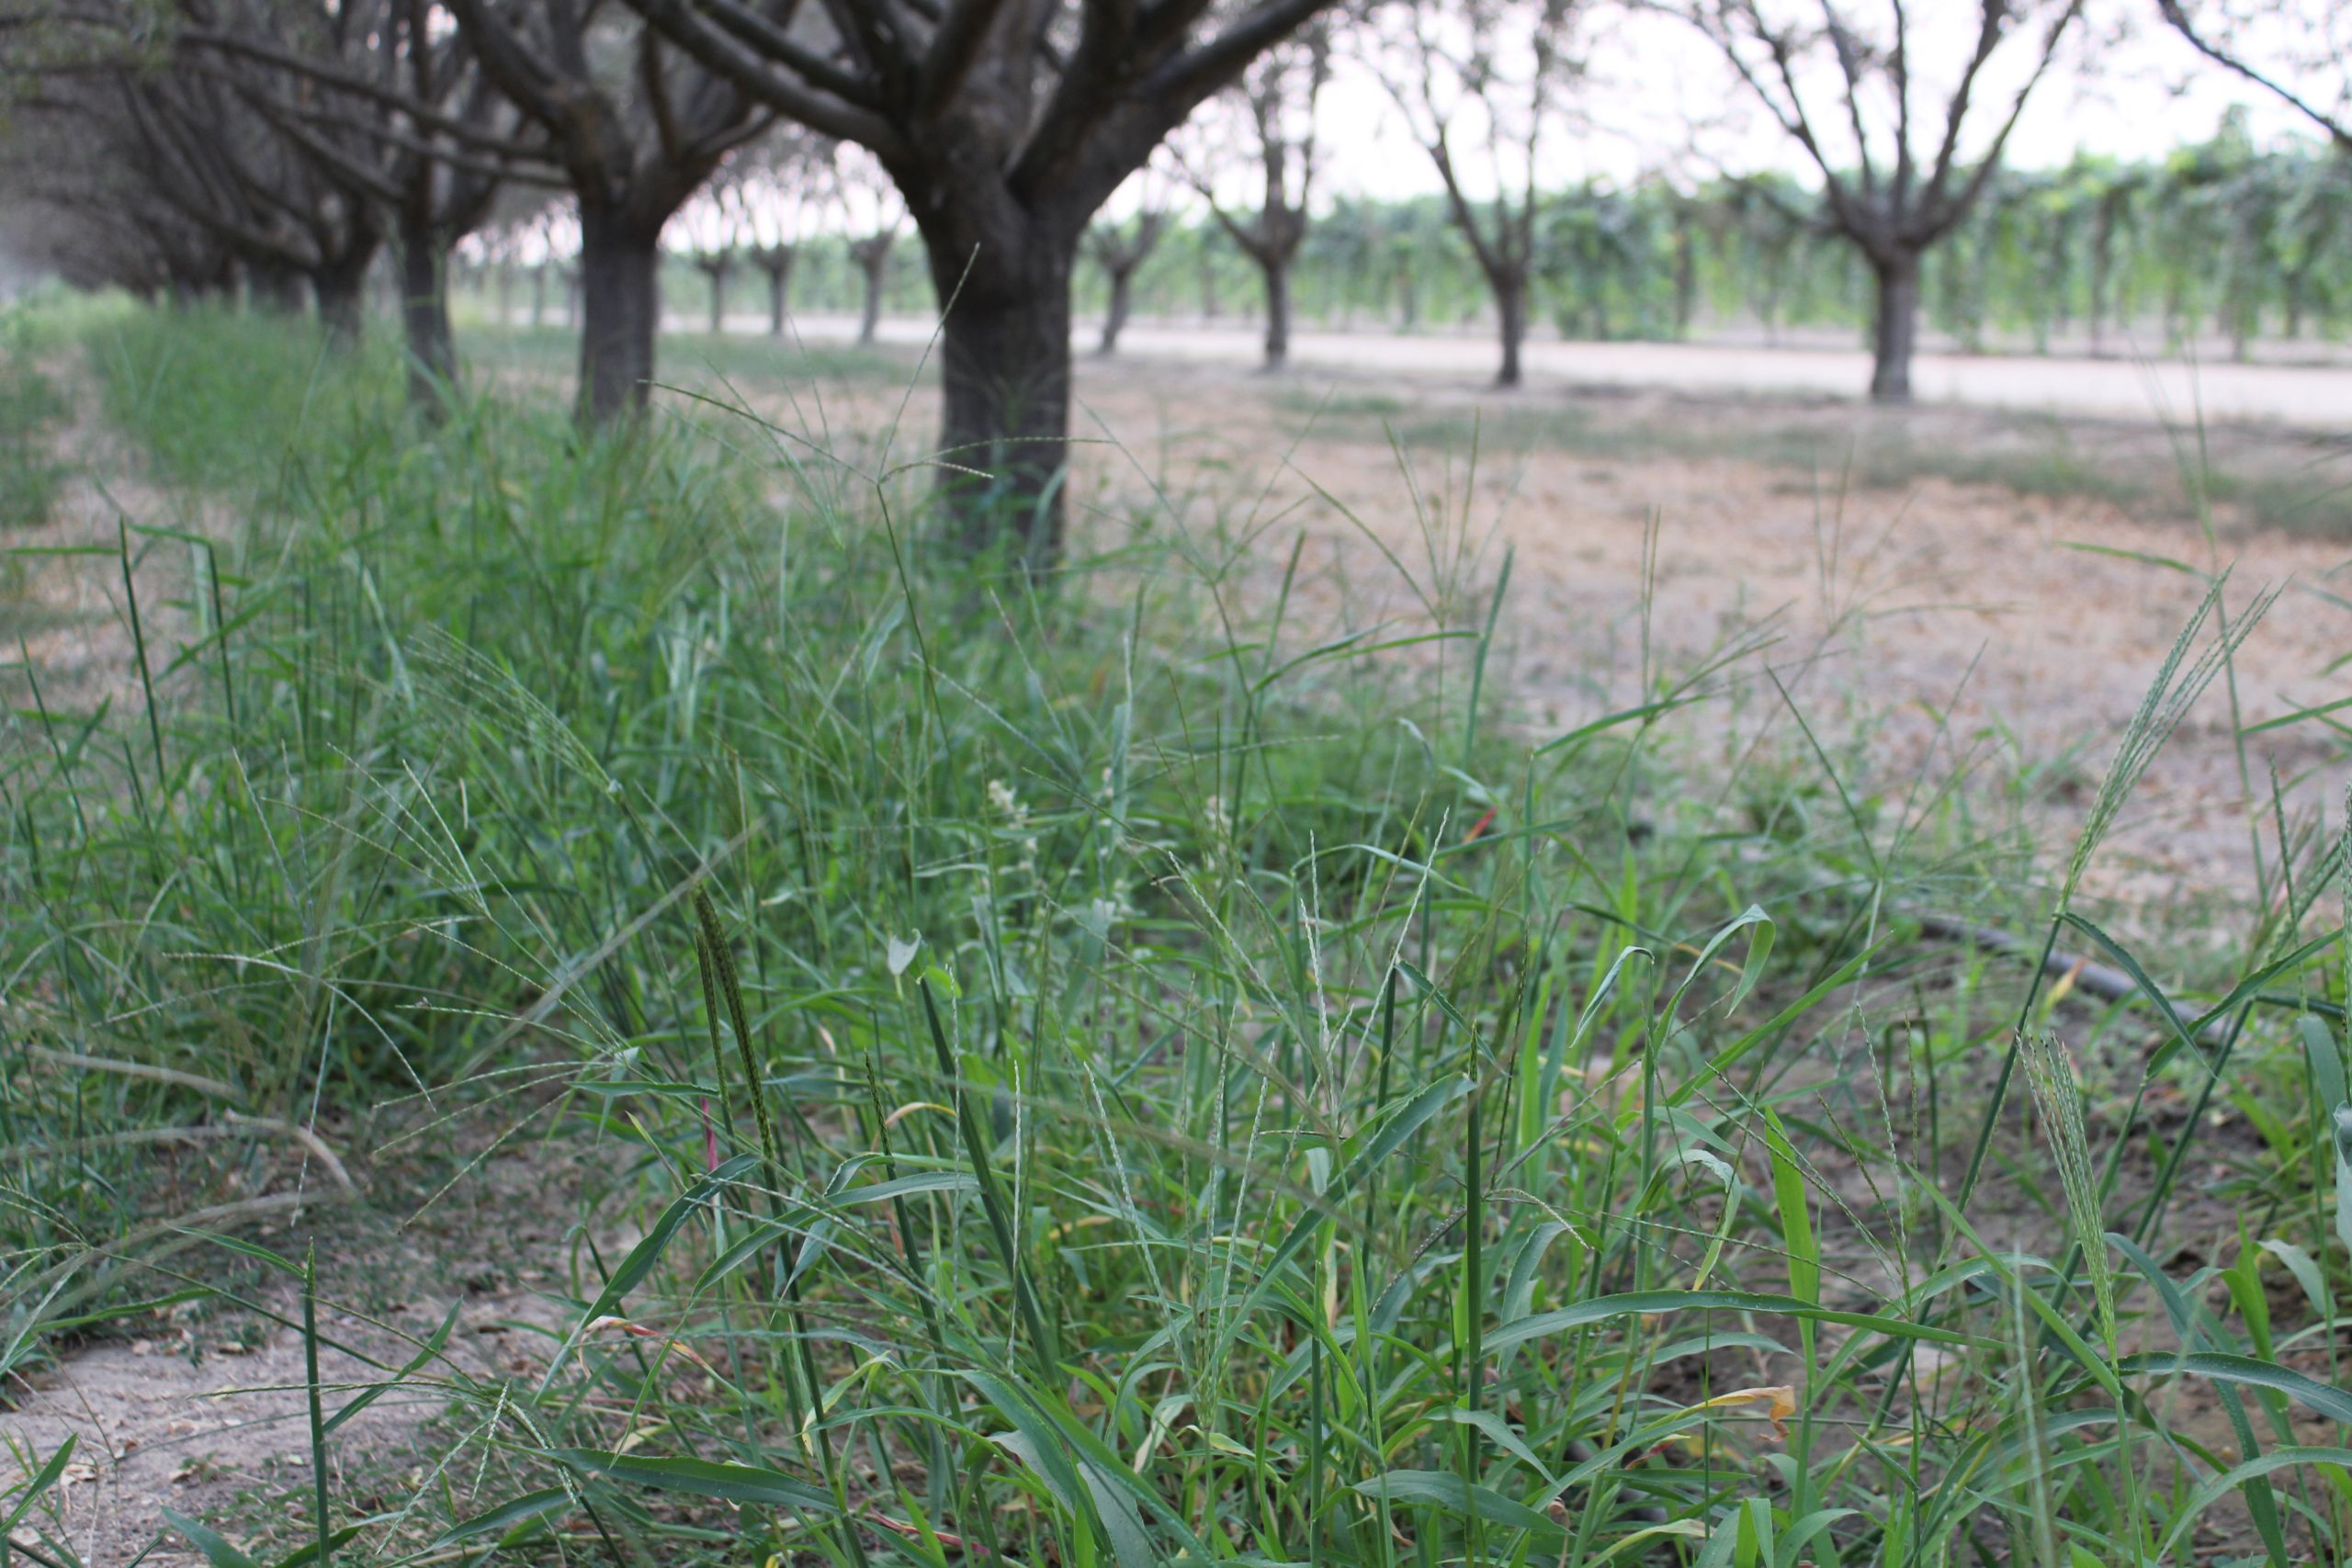
    Winter cover cropping is an agricultural management practice that can enhance soil health while protecting fields from soil erosion and compaction. Cover crops are typically grown on farmland that would otherwise be left fallow in the wintertime, such as fields used for annual spring-summer crops, or in between rows of trees or vines, and thus do not replace a cash crop. Despite its well-known soil health and ecological benefits, and popularity in other parts of the U.S., winter cover crop adoption rates are low across California’s specialty crops. To better understand drivers and incentives for adoption, we created a benefit-cost calculator that estimates how baseline profits change as a farmer integrates winter cover cropping.

    This tool was designed for specialty-crop farmers who are interested in growing winter cover crops and want to understand how long it will take for that investment to break even. However, the tool is useful for anyone interested in better understanding the financial implications of cover cropping. In this article, we explain the methodology behind the tool and how to use it.

    Methodology

    We developed a calculator that estimates the expected changes in expenses and revenues associated with the introduction of winter cover cropping for a given farming operation. We started by modeling the implications of winter cover crops to average farms that grow processing tomatoes and almonds, two of California’s most important agricultural commodities. The model estimates a benefit-cost ratio in present value terms, i.e., the ratio of the sum of benefits over the sum of costs accumulated over time and discounted to the present.

    In our baseline analysis, we considered cover crop seed mixes that are commonly used for winter cover cropping in California’s Central Valley. For tomato operations, this was assumed to be a small grain forage mix (e.g., bell beans, winter peas, common vetch) and for almonds, this was assumed to be a more expensive clover mix.

    Table 1 lists potential benefits and costs of winter cover cropping. Benefits and costs are not the same every year. The monetary values for each of these components are incorporated into the model at the specific time when that benefit or cost is likely to be experienced.

    Benefits include increased income from greater yields, which results from improvements in soil quality, fertility, and soil-water relations due to cover cropping. Benefits also include reductions in expenses associated with soil erosion control, nutrient cycling, weed control, mycorrhizal fungi colonization, and reduced tillage operations. Almond growers may also benefit from lower beehive prices.

    The potential for cover crops to affect the irrigation requirements of cash crops is debated in the scientific literature. Cover crops may lead to higher water infiltration (resulting from improved porosity of the top soil), which can lead to increased capture of winter and spring rainfall, increased soil-water storage, which in turn can delay irrigation start and eventually reduce spring/summer irrigation requirements slightly; however, these effects are soil-specific and difficult to quantify and generalize and, thus, are not included in the baseline model. Other potentially valuable aspects of cover cropping that were not explicitly accounted for in the analysis include reduced soil sealing and compaction, better soil oxygen concentration and diffusion rates, as well as increased effectiveness of salt-leaching practices.

    Furthermore, while cover cropping has been shown to improve ecosystem services and downstream user benefits, these are not included in the baseline benefit-cost calculations. These societal benefits, which include increased soil organic matter, the protection of downstream surface water quality via reduced runoff, and carbon sequestration through enhanced soil-carbon storage, were not included because they would not accrue as a revenue flow to the farmer choosing to adopt.

    Costs include the initial expenses associated with cover crop seeds, planting, and termination, depreciation of machinery used for this management practice, and time spent learning how to incorporate cover crops into an operation, as well as disseminating new instructions to crewmembers. The model accounts for financial losses due to potential harvest complications with cash crops. For example, a heavy rain at the end of March could delay termination of cover crops, and thus delay the planting of tomato seedlings, which can postpone the timing of tomato harvest. This poses a potential complication for farmers who contract with tomato canneries, resulting in penalties.

    To quantify these benefits and costs, we collected data from UC Ag Issues Center’s Cost and Return Studies, scientific publications, semi-structured farmer interviews, and field experiments to establish an average value of each benefit and cost component. We then aggregated these components to estimate benefit-cost ratios for tomato and almond production systems, where a value of the ratio greater than 1 indicates a net positive change in profits. The interactive calculator is seeded with the average value for each benefit and cost component, but can be adjusted by the user to reflect a specific farming operation. While our model attempts to be as comprehensive as possible, some potential benefits or costs are not included, such as interactions with pruning or other practices.

    Results

    When using average values for all the benefit and cost components, we find that almond systems have a benefit-cost ratio greater than 1 when considering a 30-year time horizon, meaning that benefits are likely to exceed costs on average. When using average values for the tomato system, we find the benefit-cost ratio to be less than 1, given their assumed 10-year time horizon. The time horizons of 10 and 30 years were chosen for tomato and almond operations, respectively, to reflect typical rotation patterns and crop life cycles. Figure 1 displays these results year-over-year. At the 10-year mark for tomatoes and the 30-year mark for almonds, the average benefit-cost ratios are 0.5 and 1.3, respectively, indicating that total benefits eventually outweigh total costs for almond operations, but not tomatoes.

    Winter cover cropping is an investment in the long-term viability of agricultural operations. The benefits and costs accrue differently over time and may vary from year to year. Harvest complications with a cash crop reduce profitability but can be avoided with flexible contractual obligations or by growing a cover crop with predictable senescence. Overall, our results show the value of this soil management practice is greatest for California farmers with a longer time horizon and willingness to manage a cover crop as carefully as their cash crop.

    Interactive Web-based Calculator

    The web-based cover crop calculator, partially shown in Figure 2 and available here, is an interactive decision-support tool that calculates the benefits and costs of winter cover cropping in almond and processing tomato operations. The tool estimates how much farmers can expect their profits to change after growing winter cover crops for a certain number of years. All values used in the calculator are flexible and can be adjusted to match the reality on any commercial farm. The calculator is seeded with the average values for each cost and benefit component that we considered, but the user can easily adjust or remove any component.

    The calculator assumes continuous cover cropping after the year of adoption (first year), and that all benefits of cover crops begin accruing within the first five years. Importantly, the tool may not capture every potential benefit and cost from introducing cover crops into a farming operation. It simply serves as a guide to when a farm can expect to experience economic returns, based on the monetized benefits and costs.

    As mentioned previously, cover crops could either increase or decrease spring-summer irrigation requirements. Although this component is not included in the baseline net present value model, the calculator is flexible in this variable. The user can specify the extent to which cover crops increase or decrease irrigation requirements in the growing season and can add irrigation costs to germinate the crop if needed, and then observe how their baseline profits shift accordingly. Users can also explore how a financial incentive, in the form of an annual subsidy payment per acre of cover-cropped farmland, will affect their outcomes. The calculator allows one to value the social benefits of cover cropping (ecosystem services, carbon sequestration, and downstream water quality) via this subsidy component. – By Ellen Bruno, Alyssa DeVincentis, Samuel Sandoval Solis, and Daniele Zaccaria, UC Giannini Foundation of Agricultural Economics, University of California

    Authors’ Bios

    Ellen Bruno is an assistant Cooperative Extension specialist in the ARE department at UC Berkeley. Alyssa DeVincentis is a Ph.D graduate from UC Davis in Hydrologic Sciences. Samuel Sandoval Solis is an associate professor and Cooperative Extension specialist and Daniele Zaccaria is an associate Cooperative Extension specialist, both in the Department of Land, Air and Water Resources at UC Davis. They can be reached at ebruno@berkeley.edu, ajdevincentis@ucdavis.edu, samsandoval@ucdavis.edu, and dzaccaria@ucdavis.edu, respectively. 

  • Tree Nuts Market Research and Outlook, 2020 – 2026

    Tree Nuts Market Research and Outlook, 2020 – 2026

    Tree Nuts market trends, outlook, growth opportunities and companies to 2025 presents analysis and outlook of Tree Nuts types, end user industries and countries. The global F&B market witnessed significant growth over the past decade. The report presents key trends in the Tree Nuts market and provides an overview of global and regional markets, market size forecasts, drivers and challenges across markets.

    The Tree Nuts market has been one of the rapidly recovering industries from the harsh COVID market conditions in 2020. The long-term outlook for Tree Nuts market size remains robust as companies emphasize investments in new product launches and process optimization.

    COVID-19 impact on the Tree Nuts industry

    Tree Nuts companies are strategizing focused R&D investments and planning new product launches post- COVID conditions from 2021. Further, strengthening relations with distributors, performance improvement, and cost optimization are largely observed strategies during 2020.

    Tree Nuts industry outlook and post COVID-19 pandemic opportunities:

    The report presents forecasts for Tree Nuts market revenue over the next six years from 2020 to 2026 across coronavirus spread conditions:

    • Pre-COVID Tree Nuts market scenario: Economic growth continues as usual without the impact of COVID
    • Post-COVID impact scenario: Economic recovery will begin from mid-2021 and the economy faces recession and weak supply-demand conditions

    Growth Opportunities, Market Risks, and Strategy Analysis:

    The report details strategic growth opportunities, potential market drivers, and risks in global and country-level Tree Nuts markets from 2020 to 2026. Key strategies being opted by leading manufacturers, suppliers, distribution companies, and other players in the near-term and long-term future. Potential market risks, emerging trends, and top-level strategies are included in the report.

    Segment growth outlook of Tree Nuts across markets

    The market analysis report presents the potential growth opportunities across types and applications of Tree Nuts industry size. The report models the long-term impact of new product developments, shifting consumer patterns, and swiftly changing industry dynamics on different Tree Nuts types and Tree Nuts end-user applications.

    Strategic analysis of leading Tree Nuts companies

    To make better planning decisions by suppliers and other food and beverage industry stakeholders, the report presents the strategic analysis of leading Tree Nuts companies. Opportunities in emerging markets, product launches, and technology trends are analyzed in the report.

    Tree Nuts market size forecast across 15 countries

    The US, Canada, Germany, the UK, France, Spain, China, India, Japan, Republic of Korea, Brazil, Argentina, Saudi Arabia, and other countries across North America, Latin America, Europe, Middle East Africa, and Asia Pacific are included in the report. The outlook for Tree Nuts market size growth is provided for each of the countries from 2020 to 2026.

    Tree Nuts market news and developments:

    Tree Nuts market developments including technological developments, mergers and acquisitions, product launches, business expansions, investments, new plants, and others are included in the report.


    Scope of the Study:

    • Tree Nuts Market revenue forecasts across three post-COVID pandemic case scenarios, 2020- 2026
    • Global Tree Nuts market size outlook by type, 2020- 2026
    • Global Tree Nuts market size outlook by application segment, 2020- 2026
    • Global Tree Nuts market outlook across 15 emerging and developed countries, 2020- 2026
    • Strategies, Trends, Drivers, and Risks facing Tree Nuts companies
    • Company profiles of leading five players in Tree Nuts industry
    • Market News and Developments

    This report provides insight into:

    • Understanding the impact of market conditions on the future of Tree Nuts across segments and markets
    • Developing longer-term strategies to improve customer engagement and market shares
    • Prioritizing short-term R&D and CAPEX allocations to ensure high profitability
    • Identifying key trends and market opportunities
    • Boosting revenues from existing and new consumer markets

    Methodology:

    The comprehensive and trusted guide for anyone seeking information on this industry is developed using primary interviews with suppliers, annual reports of companies, filings, news podcasts, outlook statements, statistical organizations, directories, databases, investor presentations, white papers, and others. Both top-down and bottom-up approaches are used to ensure the accuracy of forecasts.

    Why Choose this Report- APES

    A: Authored by a team of 7 analysts, headed by a manager with 14+ years of industry experience
    P: Print authentication given for single-user license
    E: Excel sheet will be provided for ease of analysis across scenarios
    S: Strategy consulting and research support will be provided for three months

     
    Purchase the full report HERE.
  • Industry Input Needed: Aluminum Phosphide, Magnesium Phosphide & Phosphine Proposed US EPA Interim Registration Review Decision

    Industry Input Needed: Aluminum Phosphide, Magnesium Phosphide & Phosphine Proposed US EPA Interim Registration Review Decision

    In September of 2020, the US EPA released their Proposed Interim Registration Review Decision on Aluminum Phosphide, Magnesium Phosphide, and Phosphine. There is a 60-day comment period on this decision with a deadline of Tuesday, December 22, 2020.

    In the review, the EPA has proposed mandatory buffer zones based on computer modeling. The proposed actions for phosphine and the metal phosphides would establish mandatory buffer zones around fumigation facilities into which bystanders may not enter during treatment or aeration of commodities post treatment. EPA is proposing a minimum of 10 feet for all fumigations and proposed buffers of 10 feet to 500 feet depending on application rate, facility, container size and other impacts of the fumigation procedures. These buffer zones could restrict your current uses of phosphine drastically, some to the point where you may no longer be able to use the fumigant.

    How does this impact the almond industry?  This decision impacts almonds, barley, grains, avocados, corn, cotton, lettuce, peanuts, pistachios, rice and more. Phosphine is a colorless gas used on commodities in storage and shipping to prevent losses due to insect and vertebrate (mainly rodent) pests. Phosphine is formulated as a pressurized gas stored in cylinders. It is the active component of the metal phosphides, released when pellets of metal phosphide interact with moisture in the air. Phosphine and metal phosphide products are registered for use on dried foods (e.g.: nuts, dried fruits, grains), on animal feed, and on processed foods (e.g.: candy, baking mixes, crackers, meats, dairy). Phosphine gas products are registered for use on non-food commodities, such as tobacco, clothing fibers, hair, wood, paper, tires, and beehives. Metal phosphide products are also registered for in-field (i.e.: greater than 100 feet from occupied buildings), in-burrow rodent control. Phosphine and the metal phosphides are applied as structural or space fumigants (e.g.: under tarps, in grain mills, in warehouses), vehicle fumigants (e.g.: railcars, trucks, containers), grain fumigants (e.g.: silos, farm storage, flat storage), and vessel/ship fumigants.

    Data from California for the years 2013 to 2017 indicate that an average of 19,900 lbs phosphine, 160,600 lbs aluminum phosphide, and 13,200 lbs magnesium phosphide were applied annually in California. The applications for all three active ingredients (a.i.s) were made to nuts (6,900 lbs phosphine, 50,200 lbs aluminum phosphide, and 67,000 lbs magnesium phosphide). Structural use including storage facilities and processing equipment (14,900 lbs aluminum phosphide, 300 lbs magnesium phosphide) was also reported. The remaining usage data do not specify a specific commodity. Similar records of usage data are not required by other states and are not available.

    Please take the time to read the below attachments and click the link to fill out the questionnaire which was developed by the manufacturer Degesch. This questionnaire should only take a few minutes to complete but is extremely valuable in responding to public comments and advocating on behalf of the industry. Time is of the essence, so we are asking for your assistance by November 30th.

    Questionnaire: Click Here.

    EPA Proposed Interim Registration Review Letter: Click Here.

    Proposed Interim Registration Review Decision Case Document: Click Here.

    Again, the industry has a deadline of December 22, 2020, to respond to the PID. Please complete your responses to the questionnaire by Monday, November 30, 2020.

    Feel free to distribute this link within your organization or to others who may be able to provide feedback on the PID proposals.

    If you have any questions, please call, Elaine Trevino at 209-300-7140 or Ed Hosoda at Cardinal Professional Products at 916-997-6045.

    For additional information please go to the EPA website at the following link: http://www.epa.gov/pesticide-reevaluation.

  • Fresno Ranked #1 Ag County in the Nation, Led by Almonds

    Fresno Ranked #1 Ag County in the Nation, Led by Almonds

    The Fresno County Department of Agriculture’s 2019 Crop and Livestock Report was presented to the Board of Supervisors today. For the second year in a row, Fresno County is the number one agricultural county in the nation.

    “Fresno County’s 2019 Crop and Livestock Report once again showcased how this region is the food capital of the world,” said FCFB CEO Ryan Jacobsen. “A significant amount of the nation’s plate originates right here in our backyard with over a third of the country’s vegetables and two-thirds of the country’s fruits and nuts grown in California, a great majority of those here in the San Joaquin Valley. In total, California holds seven of the nation’s top 10 agricultural counties, including Fresno, Kern, Tulare, Monterey, Stanislaus, Merced, and San Joaquin.”

    Overall, the 2019 agricultural production value in Fresno County totaled $7.717 billion. While the total crop production decreased 2.31 percent, Fresno County was just able to hang on to the number one spot.

    “This report is prepared in accordance with California Food and Agriculture Code and summarizes the acreage, production, and value of agricultural commodities produced in Fresno County,” said County of Fresno Agricultural Commissioner/Sealer of Weights and Measures Melissa Cregan. “The figures contained herein represent gross returns to the producers and does not reflect actual net profit.”

    Included in the 2019 report are over 300 different commodities, 78 of which have a gross value in excess of $1 million.

    “Although individual commodities may experience difficulties from year-to-year, Fresno County continues to supply the highest quality of food and fiber nationwide and abroad to more than 89 countries around the world,” said Cregan.

    Fresno County Department of Agriculture issued 17,796 phytosanitary certificates for 63 commodities destined for 89 countries around the globe in 2019. In addition, inspectors walked and certified 1,406 acres of alfalfa, lettuce, radish and onion grown for seed export.

    “During this week of gratitude and thanks typically celebrated around the dining table, we should all be appreciative to the men and women whose jobs depend on agriculture,” continued Jacobsen.

    Too often, the Crop and Livestock Report gets summarized down to just a single overall number, but it yields a significant amount of information, such as, the ability to examine changes and trends in crop acreage and yields. Amounts in the report reflect the gross income values only and does not reflect net return to producers.

    “The Crop Report is more than numbers,” said Jacobsen. “It provides the opportunity to salute local agriculture and focus on the food and fiber, jobs and economic benefits our farms provide. No matter how small or big the farm operation is, they all provide essential benefits to our community, nation and world.”

    One significant component of the report is the review of the county’s “Top 10 Crops,” which showcased the diversity of products grown here. In 2019, these crops accounted for just shy of three-fourths of the report’s value.

    This year’s Crop Report was a salute to our “superheroes” in the agricultural community, including the work done by the County of Fresno Department of Agriculture in partnership with the California Department of Food and Agriculture in protecting the agricultural industry from invasive species and pests.

    For a copy of the full crop report, click here.

    Source: Fresno County Department of Agriculture’s 2018 and 2019 Crop and Livestock Reports

    Frequently asked questions about the Crop Report:

    What is the Crop Report?

    The Crop Report is a state mandate that reflects the county’s gross value of agricultural production, separating the information by commodity group for a calendar year. Information is gathered through the use of a crop report survey from a random sample of growers, ranchers, processors, packers and many other sources.

    Due to its diversity, California is the only state that produces annual county crop reports, which are more precise and unique than other government and industry reports. The report is also the only source of specialty crop and general county data.

    Who uses the Crop Report?

    The information provided in the Crop Report helps groups, such as ranchers and growers, agricultural suppliers, agricultural lenders, agricultural research and education agencies, agricultural regulatory agencies, transportation agencies, farm labor offices and health and disease programs, plan for the upcoming year in regards to harvesting, processing, pricing, transportation and credit.

    Lenders use the Crop Report extensively to be informed of cropping trends and potential capital needs for different crops. In addition, research and education agencies use the Crop Report as a historical baseline of what is being grown. It provides valuable information in policy alternative decision making. Finally, the USDA Farm Service Agency (FSA) uses the Crop Report. During disaster relief, the FSA pays growers based on a weighted average of the crop report data for the impacted crop.

    How does it benefit Fresno County?

    Every year, there is a gap between when Fresno County fiscal year begins and ends, and when the funds from property taxes are received. Since the county cannot operate without funds, it applies for a tax and revenue anticipation note (TRAN), which is a short-term loan. The county needs this loan prior to July 1 to ensure that all county services will continue for residents.

    When Fresno County officials apply for the Standard & Poor’s Bond Rating, they present a financial package, which includes the county’s risk management strategies, current budget for the year and a forecast for the upcoming year. This portfolio highlights resources that are unique to the area and includes a page focusing on Fresno County’s record agricultural production and trends of the previous 10 years.

    Fresno County Farm Bureau is the county’s largest agricultural advocacy and educational organization, representing members on water, labor, air quality, land use, and major agricultural related issues. Fresno County produces more than 300 commercial crops annually, totaling $7.717 billion in gross production value in 2019. For Fresno County agricultural information, visit www.fcfb.org.

  • CA Court Rules Insects Not Protected by Endangered Species Act

    CA Court Rules Insects Not Protected by Endangered Species Act

    The California Superior Court in Sacramento has ruled the California Endangered Species Act (CESA) does not cover insects and that bees cannot be classified as fish. The Court issued its final ruling on Nov. 19, 2020.

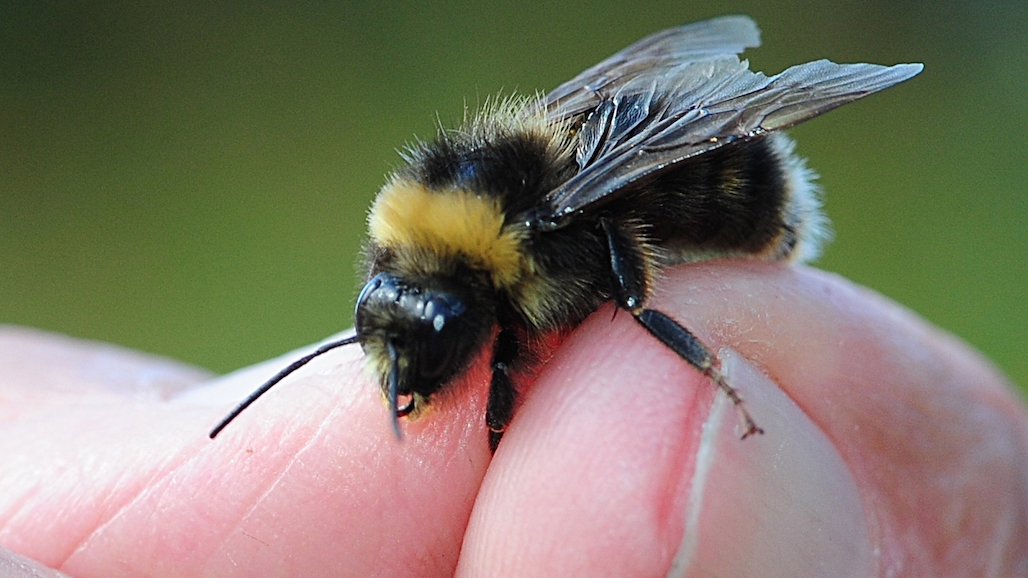
    The Almond Alliance of California, in collaboration with seven other agricultural groups, filed suit with California Fish and Game Commission in response to a vote to grant candidacy status to four subspecies of bumble bees under the California Endangered Species Act (CESA).

    The California almond industry recognizes that pollinators are integral to many natural habitats and are crucial for the production success of our industry.  The Almond Alliance of California is pleased with the ruling and reiterates that the California almond industry continues to be committed to protecting the health and well-being of bees.

    Ruling in Almond Alliance of California v. California Fish and Game Commission, Judge James P. Arguelles agreed with a group of petitioners including the Almond Alliance of California. The petitioners argued that the California Fish and Game Commission (the Commission) was not authorized by the CESA to give four species of bumble bees candidate-species status because the California Legislature was clear in the CESA that insects were not protected.

    The Commission and the California Department of Fish and Wildlife unsuccessfully argued that bees and other insects and invertebrates are covered under the CESA because “invertebrates” are included within the definition of “fish” in Section 45 of the Fish and Game Code (FGC).

    The case follows a 2018 petition from the Xerces Society for Invertebrate Conservation, Defenders of Wildlife, and the Center for Food Safety to the Commission to add the four bumble bee species to the list of endangered species under the CESA. The four species of bumble bee were the Crotch, Franklin’s, Suckley cuckoo, and Western bumble bee. The bumble bees became candidate species, meaning “a native species or subspecies of a bird, mammal, fish, amphibian, reptile or plant that the Commission has formally noticed as being under review”, when the Commission accepted the petition in June 2019. The court’s Thursday ruling set aside the Commission’s decision.

    The Almond Alliance in conjunction with our trade organization partners argued that this consideration is not justified based on the following facts:

      • Presently, no insects are listed as threatened or endangered under CESA.
      • Both the California Office of Administrative Law and the California Office of the Attorney General have previously taken the position that insects cannot be listed under CESA.
      • CESA defines candidate, threatened, and endangered species as “native species or subspecies of a bird, mammal, fish, amphibian, reptile, or plant.” The list does not include insects.

    If listed under the California Endangered Species Act (CESA), the bees would have been the first insects added. Pesticide restrictions, grazing rules, and other habitat protections could then be imposed.  While the bees are “candidates” for listing, they have the same protections as species listed as threatened or endangered.  This means prohibitions on killing them, which the Department of Fish and Wildlife routinely interprets to extend to harm to the bees or their habitat.  That could lead to uncertainty if bumble bees are present on fields or in other areas where agriculture is happening. This type of ambiguity would be disruptive to the almond industry.  For example, ripping or other soil movement could be claimed to disturb potential nesting sites.  The petitioners specifically list honey bees as a threat to the bumble bees, thus a listing could regulate placement of or reduce the number of honey bee hives.  Listing bumble bees as threatened or endangered is setting the stage for how other insect pollinators will be defined, regulated, and protected.The Almond Alliance thanks Nossaman, LLP for effectively representing the coalition and appreciates those in our industry who contributed to the legal fund to support this effort.

  • Autonomous Robot to Sample Leaves and Measure Water Potential

    Autonomous Robot to Sample Leaves and Measure Water Potential

    Every backyard gardener knows how hard it can be to tell when to water the plants. Multiply that by tens or hundreds of acres and it’s easy to see the challenges growers face keeping their crops healthy while managing water resources wisely.

    To determine water needs accurately, growers hand-pluck individual leaves from plants, put them in pressure chambers, and apply air pressure to see when water begins to leak from the leaf stems. That kind of testing is time consuming and means growers can only reach so many areas of a field each day and cannot test as frequently as needed to accurately determine optimal irrigation scheduling patterns.

    A group of researchers from UC Riverside and UC Merced have received a grant for more than $1 million from the U.S. Department of Agriculture through the National Science Foundation’s National Robotics Initiative to address these challenges. From UC Riverside are Assistant Professor Konstantinos Karydis and Professor Amit K. Roy-Chowdhury, both from the Department of Electrical and Computer Engineering. UC Merced, which leads the effort, is represented by Stefano Carpin, professor of computer science; and Joshua Viers, professor of environmental engineering.

    UC Riverside Assistant Professor Konstantinos Karydis

    As part of the project, the group is developing a robotic pressure chamber that can autonomously sample leaves and immediately test them on site to provide the freshest data. The system will work to gather data even in large fields, and over a period of time, rather than just providing a snapshot.

    Frequently updated data can help growers better plan irrigation schedules to conserve water, optimize the time and effort spent by crop specialists tasked with determining and analyzing lead water potential, and help decrease some of the costs in the food-production chain.

    UC Riverside Professor Amit K. Roy-Chowdhury

    Current measuring techniques involve collecting leaf samples and transporting them to an off-site location, where testers can use very accurate, expensive pressure chambers; or sampling and analyzing leaf samples in the field using hand-held pressure chambers.

    “In the first category, leaf samples can get mixed up, making it impossible to track them back to the specific areas of the field they came from, Karydis said. “In addition, the properties of the leaf might vary given the time elapsed between being sampled and being analyzed, which in turn may yield misleading results.”

    Hand-held instruments in the field can be less accurate, but testing can be done multiple times with different leaves from the same plants. This method is time- and labor-intensive, and must be undertaken by specially trained personnel.

    Carpin has already worked with colleagues at UC Davis and UC Berkeley to create the Robot-Assisted Precision Irrigation Delivery, or RAPID, system, which travels along rows of crops adjusting irrigation flows according to sensor data that tells the robot precisely what’s needed for each plant.

    The project will use the same mobile base robot as in RAPID but equip it with a custom-made robotic leaf sampler and pressure chamber being designed by the researchers at UC Riverside, and pair it with drones that can survey the fields and direct the robot to areas of interest.

    “Using this process, growers could survey plants all day long, even in large fields,” Carpin said.

    The four-year project will support graduate students as well as summer research opportunities for undergraduates. The project has four phases: development of the chamber; developing machine vision so the robot can “see” the water coming from the leaf stems; coordinating multiple robots — in the air and on the ground; and evaluation.

    The researchers plan to have the first set of automated pressure chamber prototypes fabricated by spring 2021, and to evaluate their performance and refine designs in controlled settings over spring and summer 2021. They expect to have a completed setup by winter 2022, so they can begin controlled field testing.

    “We have to be quick about it because if we miss a peak growing season, we have to wait another nine months for the next one,” Carpin said. “We’d like to be able to start testing next summer and test every summer, and we need to be able to maximize the tests.”

    When all of the components have been designed, the designs and code will be made open source, and all the data collected during the project will be made available to the scientific community, the researchers wrote in their proposal.

    The project came about after Carpin and Viers, director of the Center for Information Technology Research in the Interest of Society, or CITRIS, at UC Merced, had been talking with area farmers about the challenges of growing almonds and grapes. Karydis and Roy-Chowdhury had been hearing the same challenges from citrus and avocado growers in the Riverside area, so the four partnered up.

    “California agriculture presents a challenge in terms of scalability,” Carpin said. “But this an exciting collaboration because we’ll get to develop a system that will work on different kinds of crops.” — By Holly Ober, UC Riverside

  • Grower Survey to Address Future Innovations in Weed Management

    Grower Survey to Address Future Innovations in Weed Management

    Weeds can be a significant problem in berries, tree fruits, tree nuts, and vine crops (e.g. grapes, hops, etc.) especially after transplanting and during flowering and fruit and nut set. Herbicides are a primary tool for managing weeds, even though the evolution of herbicide resistance has limited the utility of many products and off-target movement can sometimes result in damage to trunks, shoots, leaves and flowers. Many growers are transitioning to organic systems to address changes in consumer preferences or satisfy the requirements set in place to enter export markets.

    Perennial cropping systems are exploring technologies such as automated harvesters and pruners, to reduce labor demands, and canopy sensing sprayers, to minimize the amounts of crop protection chemicals applied to shrubs, trees, and vines. Novel weed control tools that eliminate or reduce the need for herbicides are actively being developed for and marketed in the agriculture and horticulture industries. These new technologies could begin to play and increasingly large role in future crop production, particularly in high-value specialty crops that 1) have limited herbicide options, 2) are sensitive to herbicide injury, and 3) are heavily reliant on a labor market that is simultaneously growing more scarce and more expensive.

    A team of weed scientists from UC Davis, Oregon State University, and Cornell are asking berry, tree fruit, tree nut, and vine crop growers to take 5 to 10 minutes and answer this short and anonymous survey (link below) about your current weed management practices and your interest in novel technologies, like vision-guided sprayers and cultivators, and electric, steam, and pressurized water weeders. This will help us plan research and extension projects that will address stakeholder concerns regarding the future of weed management.

    There’s always a chance that we forgot to include some amazing tools that are emerging on the horizon; please feel free to e-mail Lynn Sosnoskie at lms438@cornell.edu and let her know what you think the future of weed control will look like.

    Thanks for your time. We appreciate your support of weed science research.

    Survey link: https://cornell.ca1.qualtrics.com/jfe/form/SV_bEpfAijoP7puQDP

  • How to Maximize Groundwater Recharge, Addressed at Upcoming Almond Conference

    How to Maximize Groundwater Recharge, Addressed at Upcoming Almond Conference

    Almond Board of California — Ensuring there is enough water from surface and underground supplies to meet all the state’s demands is a complicated and often controversial task. As author Mark Twain famously said, “Whiskey is for drinking. Water is for fighting.”

    Groundwater usage and potential recharge opportunities are huge points of discussion in the California agricultural industry, particularly in the San Joaquin Valley. Approximately 2 million acre-feet more groundwater is pumped in this valley each year than is replenished to provide drinking water for people and nourishment for an enormous variety of annual and perennial crops, including almond trees.

    In 2014, the state passed the Sustainable Groundwater Management Act (SGMA), setting deadlines for sustainability in many almond-growing regions by 2040. The act mandated the formation of Groundwater Sustainability Agencies (GSAs) to oversee management and recharge efforts in specific local groundwater basins.


    Recharge is one of the primary methods to replenish groundwater basins on the supply side of the equation, which is why it again will be the focus of a session at The Almond Conference. This session will be held on Tuesday, Dec. 8 at 10 a.m. PT. 

    The session will feature three experts on water issues in California:

    • Stacey Sullivan, policy director for Sustainable Conservation. Sullivan will discuss state water policies that affect recharge, such as water rights.
    • Scott Hamilton, a consultant for San Joaquin Valley Water BlueprintHamilton will discuss infrastructure and conveyance as part of recharge efforts, including the availability of canals and pipelines to move water as well as who is responsible to pay for said infrastructure.
    • Laura Ramos, program manager at the California Water Institute at California State University, Fresno. Ramos will focus on how recharge efforts – including those undertaken by the ag industry – can improve drinking water supplies, particularly for those in more disadvantaged areas of the San Joaquin Valley.

    Session explores options for recharge

    Recharge is a serious topic for almond growers, many of whom rely on pumping to augment whatever surface water allocations they receive each year.

    According to the Public Policy Institute of California’s Water Policy Center, intentional groundwater recharge efforts could fill about 25% of the gap between current supply and demand for groundwater in the San Joaquin Valley, putting up to 500,000 acre-feet of water back into aquifers each year. Without mitigation, the San Joaquin Valley Blueprint estimates as many as 1 million acres in ag production today could be fallowed in years to come.

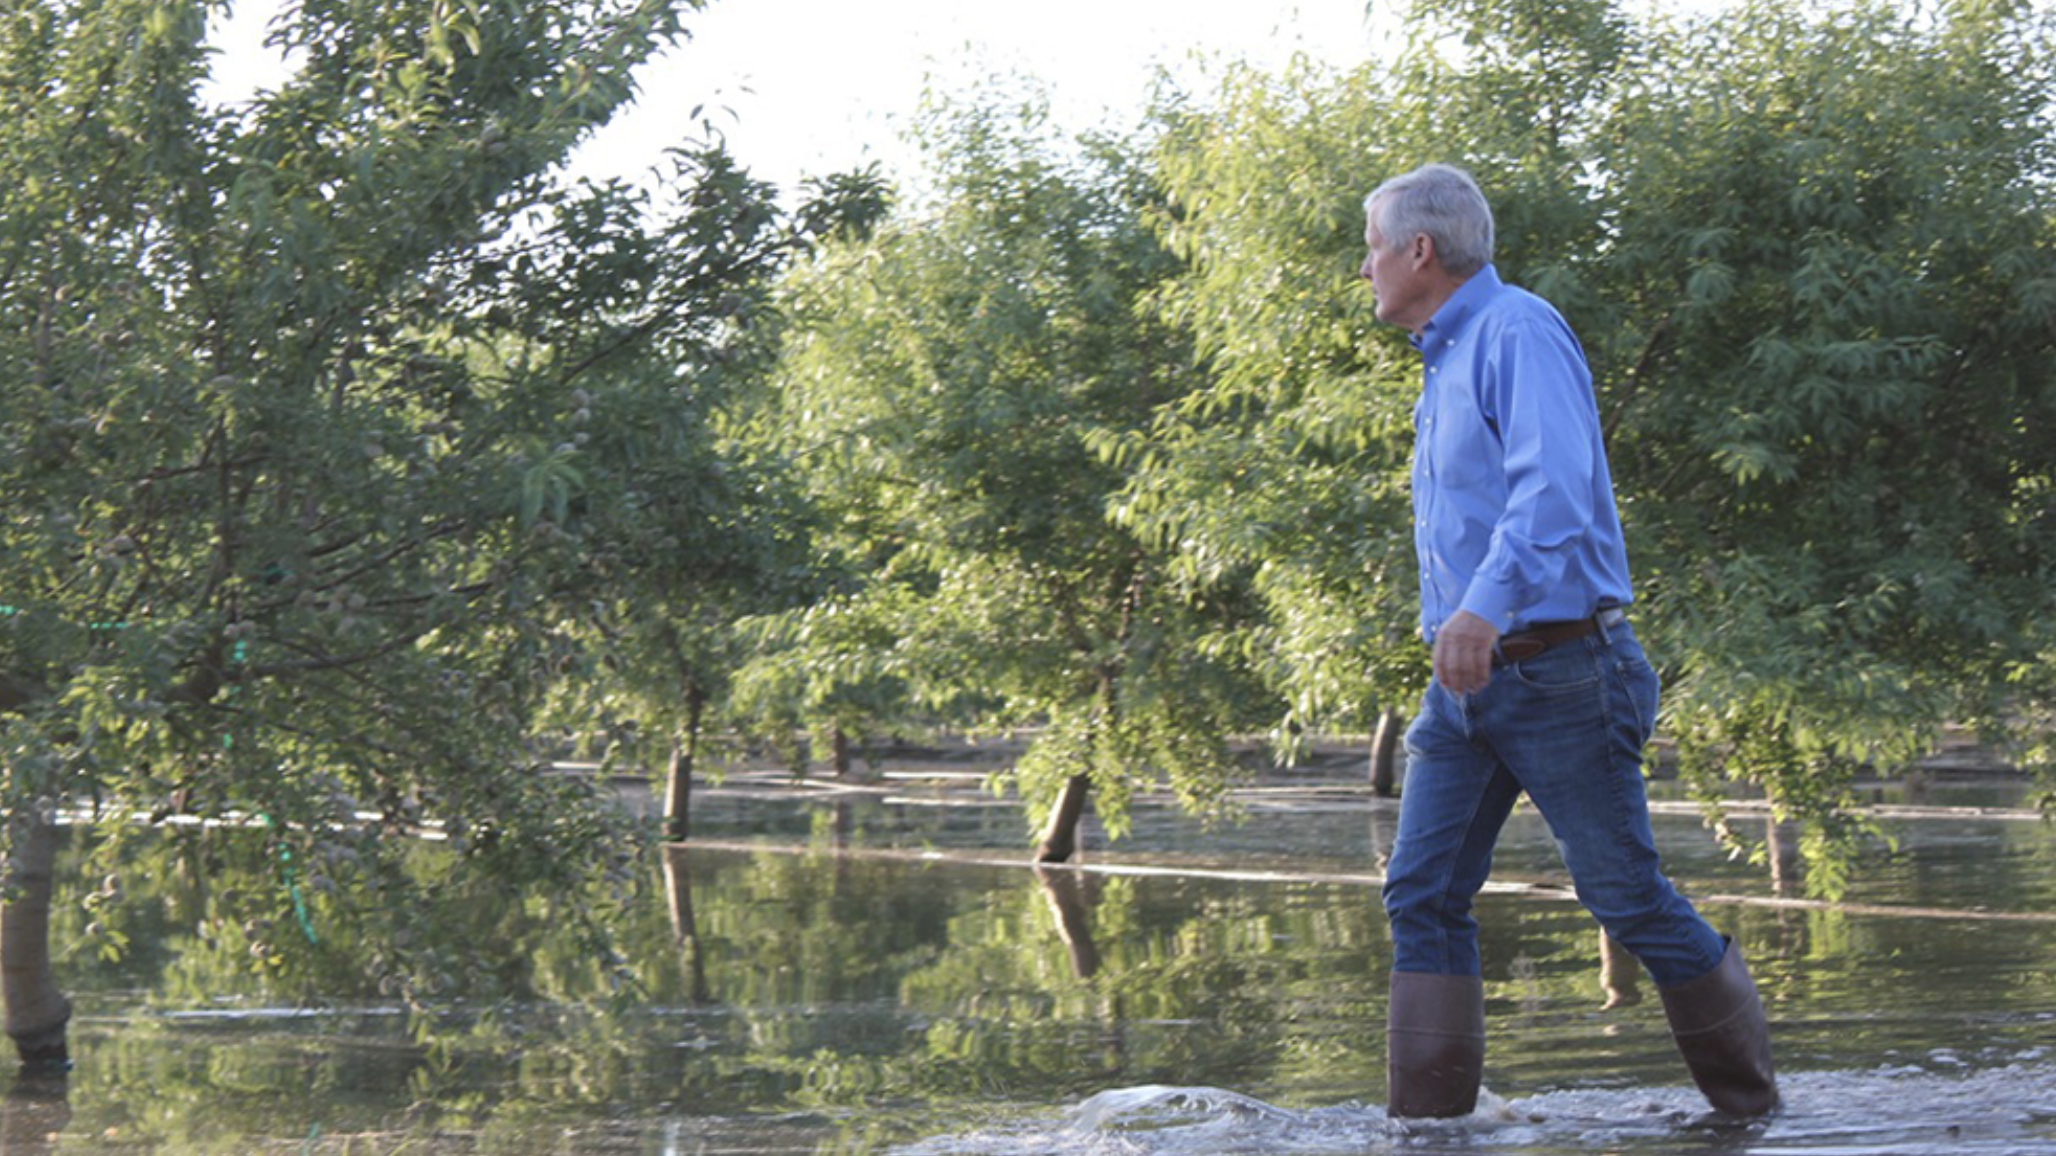
    There are several options for growers who want to try groundwater recharge. The simplest method involves using existing flood irrigation systems in the dormant season, when there is excess available water that can percolate down and replenish the aquifer. If a flood irrigation system isn’t available, the soil doesn’t drain well, or other obstacles stand in the way, growers can consider: 

    • installing a groundwater recharge pond on their property outside the orchard,
    • fallowing an area within in the orchard that is best suited for recharge in order to develop a pond (sandy areas are optimal), or 
    • working with a GSA to develop recharge projects elsewhere in one’s basin.

    Jesse Roseman, principal analyst for Environmental and Regulatory Affairs at the Almond Board of California (ABC), will moderate the session. His hope is that the discussion spurs growers to “think through the factors involved in recharge to better understand if this practice is right for their orchards.”

    Though many of SGMA’s potential restrictions on groundwater pumping won’t take effect for many years, the possibility of consecutive years of below-average rainfall and snowfall years always threatens growers’ access to surface water – and puts pressure on aquifers.

    “Some counties have already tightened up on approving new wells,” Roseman said. “If we have below-average rainfall again this year, reservoirs will be drawn down, impacting surface water allocations.”


    Groundwater guide supports grower decisions

    Beyond the session on recharge, the Almond Board of California (ABC) and Sustainable Conservation are collaborating on a Groundwater Recharge Guide that will be published in early 2021 and distributed via an Industry Roadshow. As part of this roadshow, ABC’s Field Outreach and Education team, along with other staff, will travel throughout the growing region of the Central Valley to meet with industry members and distribute content that would have typically been provided at an in-person Almond Conference. Stops along the roadshow will include locations in your area, including coffee shops, Farm Bureau offices and other places that people can safely gather during the pandemic.

    “The document will give growers a starting point to learn about recharge and how it might not only fit into their farming operation, but also help achieve basinwide sustainability,” Roseman said. “Recharge won’t be an option on every farm or even in every basin, but we want to provide guidance based on research, informing growers on what questions to ask before they try it out.”

    Mark your calendar for Tuesday, Dec. 8 at 10 a.m. to attend the session on groundwater recharge, and check out The Almond Conference 2020 webpage for the event’s complete agenda. As a reminder, The Almond Conference 2020 will be held completely virtually.

  • Modifying Marketing Orders to Face New Challenges

    Modifying Marketing Orders to Face New Challenges

    Growers’ strategies to enhance the economic sustainability of their farms are constantly evolving to address changing markets and production conditions. State or federal marketing orders enable farmers, farmer-organizations, and, in some cases, handlers to act collectively to further their mutual economic interests without violating anti-trust law. In order for marketing orders to be relevant with changing agricultural conditions, they must periodically have modifications made to their rules and regulations. Changing the scope of a marketing order’s regulations involves undertaking a thorough rule-making process, which generally takes significant lead time before approval and implementation of changes. In this article, we examine recent efforts by the California Walnut Board to update its order in three key dimensions.

    A marketing order is formed when a majority (usually two-thirds) of growers accounting for a majority of production vote in favor of it, although specific rules vary. Once formed, participation is mandatory for all producers and first handlers of the given crop in the relevant geographic area. (A first handler takes the commodity from the farmgate and introduces it into the marketing chain.) A per-unit assessment on sales funds the marketing order’s activities. Federal marketing orders can engage in activities in the following categories: promotion and advertising, research and development, quality regulation, pack and container requirements, marketing information, quantity regulation, and import regulation. They cannot use funds for political lobbying.

    While activities in all of these categories can be included in a marketing order, the specific activities permitted for a specific marketing order are defined in federal or state regulation when it is formed. Changing these activities requires completing a federal rule-making process. One federal marketing order,the California Walnut Board (CWB), has recently initiated processes for three changes in its activities, each within a different category. We examine these proposed changes and distill lessons for other orders that may consider updating their regulations.

    The CWB is proposing to implement a “credit-back” program within the portion of its order dealing with advertising and promotion. It requires review through a formal rule-making process and a grower referendum. The other two proposed changes require review through a relatively streamlined informal rule-making process. One proposes suspending an existing volume control authority, which has not been exercised in decades (quantity regulation).

    The other proposes expanding the information collected from handlers (marketing information). The proposed credit-back program is intended to incentivize handlers to engage in advertising and promotion activities by refunding them a portion of the money they spend, which effectively lowers the marginal cost of these activities. If handlers perceive a marginal benefit to additional expenditures and set marginal benefit equal to the marginal cost as predicted by economic theory, then they will increase spending. The program would refund handlers up to 70% of their spending on eligible advertising and promotion expenditures, subject to a handler-specific maximum.

    The maximum amount available to a handler is the same share of the credit- back program budget as its share of total walnut acquisitions in the previous year. Thus, a handler who had 10% of total acquisitions would be eligible to be reimbursed for eligible expenditures totaling up to 10% of the total funds budgeted for the credit- back program. If the program budget were $1 million, the handler would be eligible for $100,000 in reimbursement. At the proposed maximum 70% reimbursement rate, the handler would need to spend $142,857 in eligible expenditures to receive the entire reimbursement.

    The proposed credit-back program would require handlers to include ‘California Walnuts’ on the primary face label and include the handler’s name or brand on the package. This requirement could aid in differentiating California walnuts from walnuts produced elsewhere, potentially leading to higher prices for California producers. Handlers participating in the credit-back program will have a decrease in net assessment costs because a portion of their marketing expenses will be credited back. Costs will be unchanged for handlers who do not participate. Handlers can choose whether to participate, and will only do so if they perceive a positive net benefit from the program.

    The credit-back program intends to expand total advertising and promotion expenditures for California walnuts, thereby enhancing demand and market price. Its effectiveness will depend on the extent to which handlers increase their expenditures beyond those they already make.

    Advertising & Promotion: Credit-back Program
    Advertising is predicted by economic theory to increase demand for the advertised product by “shifting” it outward, increasing the price for any quantity sold, and increasing the quantity sold at any given price. Empirical analyses of commodity advertising and promotion for specific marketing order programs, including many in California, have found these programs to be highly effective in expanding demand. If the credit-back program prompts an increase in total advertising and other demand-enhancing expenditures, including those by handlers and by the Board, economic theory predicts that gross revenues accruing jointly to growers and handlers will increase.

    There are multiple ways in which additional advertising and promotion expenditures could increase demand. First, current walnut consumers could purchase more walnuts. Second, new consumers could choose to purchase walnuts. Finally, handlers could create or expand additional sales channels due to the development and sale of value-added products, potentially increasing net returns above those obtained by commodity sales.

    Figure 1 illustrates the effects of an increase in demand on price when supply (S1) is fixed at quantity Q1. The fixed supply approximates the situation within a single marketing year when the crop has limited or no storability across years. Demand curve D1 represents the quantity buyers will purchase as a function of price, where Q1 is sold at the price P1. D2 represents an increase in the demand curve due to advertising, which increases the price for Q1 to P2. Thus, an increase in demand due to increased total advertising and promotion expenditures from a credit-back program would increase the observed market price when the quantity supplied is fixed.

    Figure 1 holds the supply curve constant. However, the production of most crops tends to increase over time due to technological innovations, and growers may respond to changes in the relative profitability of different crops by changing their acreage allocations. All else equal, an increase in supply, regardless of its nature, will reduce price. This behavior is represented in Figure 2 by the annual quantity harvested increasing year-on- year from Q1 to Q2. As in the previous figure, the initial market price P1 is where the initial demand curve D1 intersects with the initial supply.

    The second demand curve D2 again represents the effect of advertising on price. The new market price P3 is at the intersection of the increased demand curve (D2) and the increased supply curve (S2). In this example, due to the increase in quantity, price declines to P3; the negative effect of the increase in supply on price outweighed the positive effect of advertising.

    Depending on the nature of the shifts in supply and demand, the observed price may decline, increase, or stay the same. However, the observed price will always be higher than the price would have been if demand did not increase. In other words, observing a price increase is not a requirement for demonstrating that advertising is effective.

    Figure 2 illustrates this point. The price determined by the interaction of the initial demand curve and the second supply curve is lower than the price when advertising shifts out demand as well. All else equal, an increase in demand due to advertising and promotion would increase the market price. However, the substantial increase in production can more than offset any such effect, so that a net price decrease is observed. In that case, while the price is lower (P3) than the initial price (P1) due to the increase in supply, it would have been even lower (P4) had there not been an advertising-induced demand increase.

    Table 1 quantifies potential benefits of a credit-back program for the specific case of the California walnut industry. Earlier work by one of the authors estimated that each dollar invested in advertising and promotion of California walnuts generated $19.75 in total revenue and $15.67 in net returns on average. Assuming a $0.04 assessment rate per hundredweight and total production of 625 million cwt., the CWB’s total annual budget is approximately $25 million. If the credit-back program budget is assigned 10% of assessments, then it would have $2.5 million to allocate each year.

    The success of the credit-back program will depend on the extent to which it increases total expenditures on advertising, promotion, and other demand-enhancing expenditures, including those by handlers and the CWB, all else equal. If handlers do not increase their expenditures, then there will be no positive impact on price, although handlers’ net returns would increase due to the partial reimbursement of their current costs.

    At the other end of the spectrum, if all handlers requested their maximum amount of credit-back and used all of the funds to match new expenditures rather than substituting for any existing ones, then they would invest an additional $3.25 million in advertising and promotion: 70% of these expenditures would be credited back, totaling the $2.5 million in the program budget. The remaining 30% would be a $1.07 million increase in total advertising and promotion expenditures, paid by handlers. Multiplying the estimated returns per dollar by the additional expenditures by handlers, the program would generate roughly $21.2 million in additional total revenues and roughly $16.8 million in additional net returns.

    Volume Control: Suspending the Reserve Authority
    One of the CWB’s authorized activities is the annual creation of a reserve based on market conditions that assigns “free” (eligible for sale domestically), export, and reserve percentages to production volumes. It has not exercised this authority in over thirty years, due to a strategic decision in the 1980s to focus on enhancing demand rather than regulating supply.

    The CWB is seeking to suspend this authority through the USDA’s informal rule-making process. Suspending the authority would eliminate the need for a committee to evaluate the desirability of establishing a reserve when market conditions have made the concept of a reserve effectively obsolete.

    Marketing Information: Expanding the Scope of Reporting
    Currently, the CWB is authorized to collect information regarding walnut shipments from handlers. While assessment income is based on shipments, shipment data does not provide a complete picture of walnut volume availability. The CWB is currently seeking the authority to expand permitted reporting to include volumes that have purchase commitments but have not been shipped. This proposed change enables the information collected by the CWB to better reflect the conditions of modern agricultural markets in which an increasing share of purchases are committed to prior to shipment. Knowing the volume that already has a purchase commitment in addition to knowing the volume that has been shipped will provide handlers with a more complete picture of market conditions when negotiating sales.

    Modernizing Marketing Orders for Other Commodities
    As markets continue to evolve, marketing orders will continue to adapt to meet market conditions. Adaptations will include modifying traditional functions—as the CWB is proposing for information collection— and introducing and expanding new ones. The California Rice Commission, for example, has increased its focus on environmental quality and regulatory compliance and reduced its direct marketing-related activities since it was founded in 1999 as a replacement for earlier industry organizations. (It remains involved in marketing through its membership in the U.S. Rice Producers Association.) Increasing regulation of agriculture may make moving in the same direction more attractive for other marketing orders as well.

    While production research has long been a traditional marketing order function, over time, funding health research has emerged as a priority for many commodities. As consumers’ interest in designing a diet to meet their individual health needs continues to increase, health research is likely to continue to be a growth area for enhancing consumer demand for individual commodities. However, funding health research must be included as one of a marketing order’s approved activities. If it is not, the marketing order must be amended to include it. These types of successful adaptations by marketing orders will enable them to continue to meet the original objective of enhancing the economic sustainability and stability of U.S. agriculture. — By Rachael E. Goodhue & Harry M. Kaiser, Giannini Foundation of Agricultural Economics, University of California

    Authors’ Bios
    Rachael Goodhue is Professor and Chair in the Department of Agricultural and Resource Economics at UC Davis. She is the Public Member and Chair of the California Walnut Board. Harry Kaiser is Gellert Family Professor and Associate Dean for Academic Affairs in the Charles H. Dyson School of Applied Economics and Management at Cornell University.

    The opinions expressed in this article are the authors’ own and not those of the California Walnut Board or
    the United States Department of Agriculture.