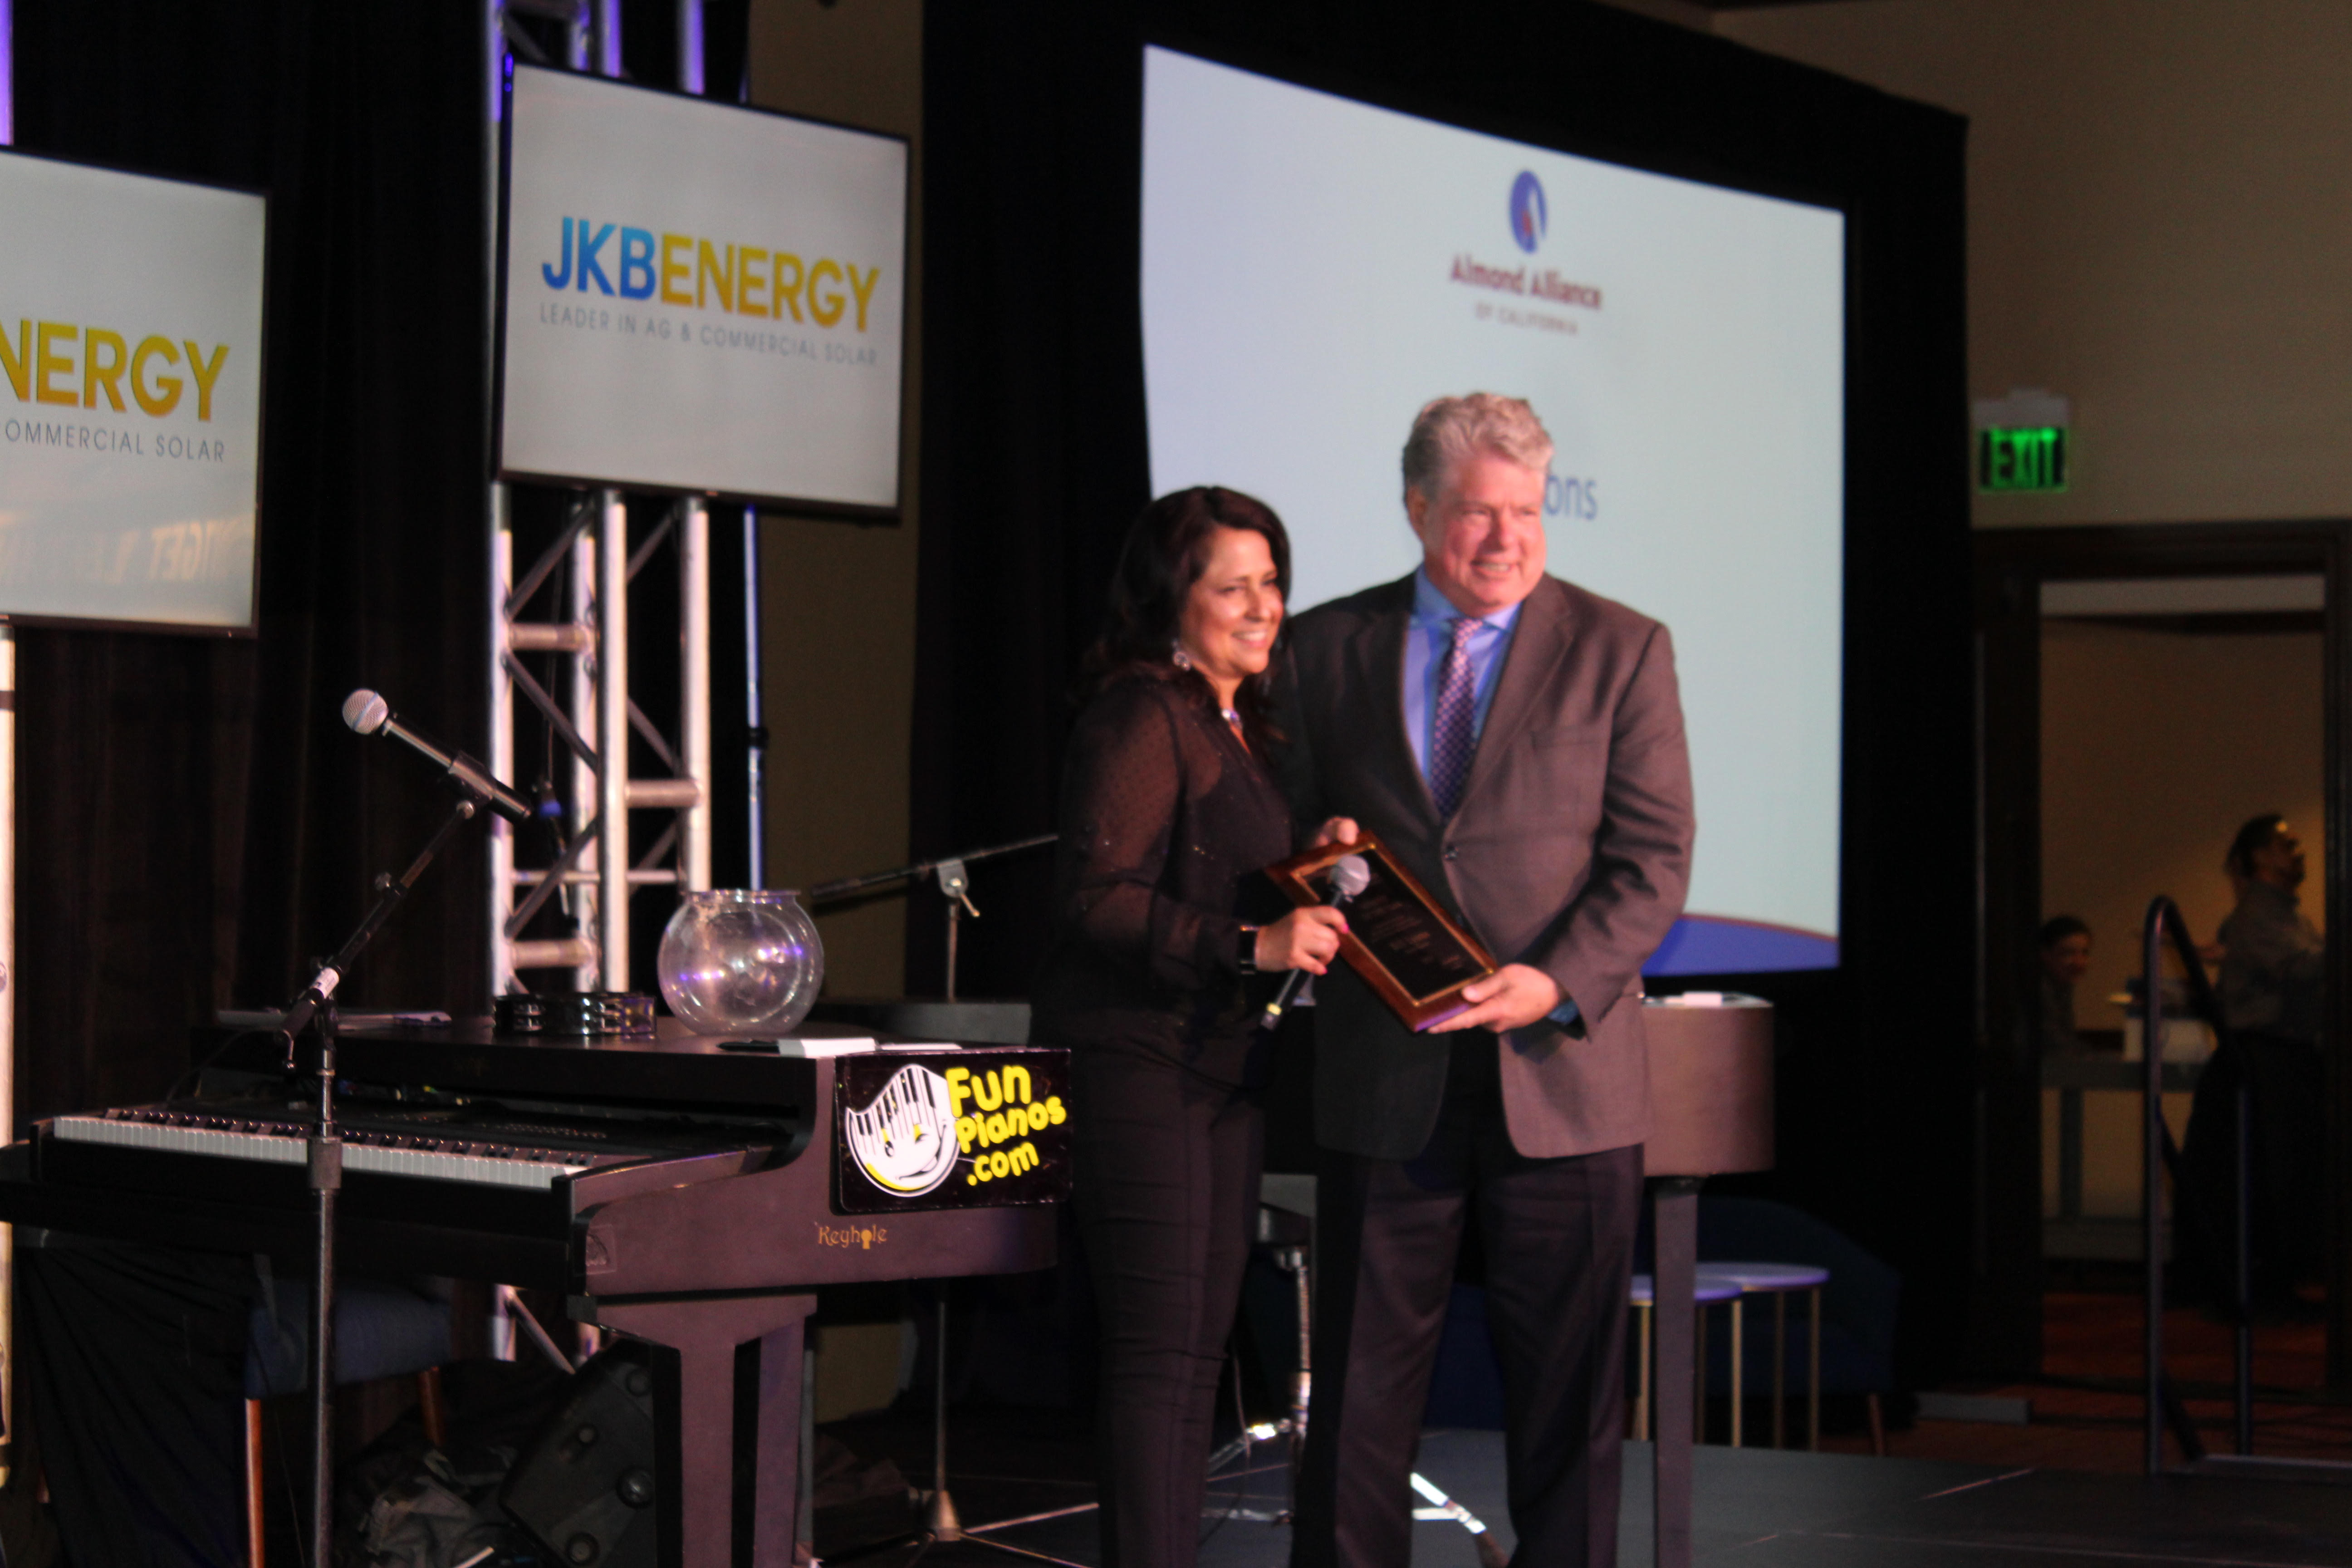
The Almond Alliance of California has selected Bill Lyons, a third generation farmer from Modesto, as its Member of the Year. The award was announced at the Alliance’s annual convention held in Napa April 30-May 2.
“Bill played a leading role in helping transform the former Almond Hullers and Processors Association into the Almond Alliance with an increased emphasis on advocating for all sectors of the California almond industry,” explained Alliance President Elaine Trevino. “He has been a relentless advocate for the industry and was instrumental in forming the California Almond Industry Political Action Committee, helping to give the industry high visibility among state decision makers. He has also distinguished himself as chair of the Alliance’s Government Relations Committee which provides guidance to the board on critical legislative and regulatory issues impacting the California almond industry.”
Lyons was recently appointed by Gov. Gavin Newsom as Agriculture Liaison in the Office of the Governor, responsible for reporting to the Newsom Administration on a wide range of agricultural and water policy issues. Under Gov. Gray Davis, he served as Secretary of the California Department of Food and Agriculture from 1999 to 2004.
While Lyons has stepped down from his Alliance roles due to his appointment, he remains a strong voice for the California agriculture on issues ranging from water to foreign trade. “Bill understands the complexity of production, food safety, environmental, water and trade issues affecting California agriculture,” said Trevino. “He brings us a seat at the table and provides a much needed balanced perspective to critical policy discussions.” Bill understands the importance of including diversity of opinions in important policy discussions.
During the time he oversaw his family’s 95-year-old farming and cattle ranching operation in Stanislaus County, Lyons has received numerous national and state awards for his environmental stewardship and conservation efforts. The family farming operation produces a wide range of agricultural commodities, including almonds, walnuts, tomatoes, corn, wheat, oats, rye, alfalfa, beans and wine grapes, as well as beef cattle.
Lyons served from 1984-1993 as a director on the Modesto Irrigation District, which serves over 250,000 electrical urban and agricultural and water customers, providing him a unique perspective on the issues facing both agriculture and urban water and electrical customers.
As a conservationist, Lyons has been recognized by the United States Fish and Wildlife Service for his conservation and environmental efforts, and has received the United States Department of Agriculture National Environmentalist Award. He was selected as the western regional finalist for the National Fish and Wildlife Foundation 2010 Conservationist of the Year Award.
Bill’s alma mater, California State University at Chico, honored Bill in 2000 with the Distinguished Alumni Award. He and his wife, Suzy, live in Modesto and have four children and five grandchildren.
Read more about the proceedings of the Almond Alliance’s 2019 convention in the coming issue of Pacific Nut Producer Magazine. Subscribe for FREE today at:
About the Almond Alliance of California
The Almond Alliance of California (AAC) is a trusted non-profit organization dedicated to advocating on behalf of the California almond community. California almonds are an economic powerhouse, generating more than $21 billion in economic revenue and directly contributing more than $11 billion to the state’s total economy. California’s top agricultural export, almonds create approximately 104,000 jobs statewide, over 97,000 in the Central Valley, which suffers from chronic unemployment. The AAC is dedicated to educating state legislators, policy makers and regulatory officials about the California almond community. As a membership-based organization, our members include almond processors, hullers/shellers, growers and allied businesses. Through workshops, newsletters, conferences, social media and personal meetings, AAC works to raise awareness, knowledge and provide a better understanding about the scope, size, value and sustainability of the California almond community. For more information on the Almond Alliance, visithttps://almondalliance.org/or check out the Almond Alliance on Facebook, Twitterand Instagram.
After years of drought, the 2019 winter is turning out to be a good one for California’s water supply. Several winter storm systems in the past couple of months means there is plenty of water. In some parts of the state, more than plenty, as evidenced from flooding events. Snow pack is above average (156%) and reservoirs are sufficiently full. So, farmers can rest easy, eh? Not so fast.
Some of you may have heard that in December 2018 the State Water Resource Board announced that up to 50% of the water flowing through Lower San Joaquin River and its tributaries – the Stanislaus, Merced and Tuolumne river will be required to flow unimpaired, i.e. without diversions. The Water Board contends this is needed to restore critically endangered fish species dependent on the flow. A second phase of the plan would see similar flow requirements for the Sacramento River and its tributaries – the Feather, Yuba and American Rivers. As you can imagine, this will have a severe impact on agriculture dependent on this water.
However, this is not a done deal. There are other regulatory processes that must be followed before the plan can go into effect. But already, legal challenges have been made to this so called “Bay Delta Plan”. Several agricultural commodity groups, including the California Walnut Commission, have voiced their opposition. Critics of the plan argue that voluntary water sharing agreements between various stakeholders can yield better results than arbitrary unimpaired flow decisions. Furthermore, they point out that water flow is just one of the factors affecting species survival. Habitat loss is another critical factor to be taken into account. Mere unimpaired water flow would not be as beneficial to species restoration. To that end, cooperation among various stakeholder groups-agricultural water rights, urban drinking water, and environmental groups, is the appropriate way to go.
Another regulatory issue of importance is the Sustainable Groundwater Management Act (SGMA). This was passed in 2014, at the height of the California drought, to avoid severe depletion of groundwater and its quality. The first phase of SGMA implementation is approaching in 2020. Local water agencies will need to start implementing Groundwater Sustainability Plans (GSP), which will include annual tabulation of how much groundwater is being extracted. Growers should have heard by now from their local water agencies as to which Groundwater Sustainability Agencies (GSA) they belong to and what the annual reporting requirements are.
Regardless of the regulatory issue, the California Walnut Commission will continue to make sure the opinions of the California Walnut industry are represented.
USDA extended the deadline to May 17 from May 1 for agricultural producers to certify 2018 crop production for payments through the Market Facilitation Program (MFP), which helps producers who have been significantly affected by foreign tariffs, resulting in the loss of traditional exports. USDA’s Farm Service Agency (FSA) extended the deadline because heavy rainfall and snowfall have delayed harvests in many parts of the country, preventing producers from certifying harvested production.
Payments will be issued only if eligible producers certify before the updated May 17 deadline.
The MFP provides payments to producers of corn, cotton, sorghum, soybeans, wheat, dairy, hogs, fresh sweet cherries and shelled almonds. FSA will issue payments based on the producer’s certified total production of the MFP commodity multiplied by the MFP rate for that specific commodity.
“Trade issues, coupled with low commodity prices and recovery from natural disasters, have definitely impacted the bottom line for many agricultural producers,” said FSA Administrator Richard Fordyce. “The MFP payments provide short-term relief from retaliatory tariffs to supplement the traditional farm safety net, helping agricultural producers through these difficult times. Weather conditions this fall, winter and early spring have blocked many producers from completing harvest of their crops, and we want to make sure producers who want to finalize their MFP application have an opportunity.”
U.S. Secretary of Agriculture Sonny Perdue launched the trade mitigation program to assist farmers suffering from damage because of unjustified trade retaliation by foreign nations. FSA implemented MFP in September 2018 as a relief strategy to protect agricultural producers while the Administration works on free, fair and reciprocal trade deals to open more markets to help American farmers compete globally. To date, more than $8.3 billion has been paid to nearly 600,000 applicants.
The MFP is established under the statutory authority of the Commodity Credit Corporation Charter Act and is administered by FSA.
Emission devices or emitters are vital component of drip/microirrigation systems as they control the dripping (emission) of water and fertilizer solution to the plant.Drip emitters basically slow down the flow rate to a “trickle” by dissipating the energy of the flow through frictional resistance.This makes it possible to deliver water and fertilizer solution to the plant in a frequent localized manner and at, essentially, constant rate; and that is the principal advantage of this method of irrigation.
Efficiency of a drip irrigation system refers to the ratio of the water delivered to the plant to satisfy its water requirements to the total applied water.High efficiency of a drip system is usually desired. Emission uniformity (EU) is a prerequisite for the high efficiency of the system as will be explained later.
Though drip systems are designed around EU, emission uniformity of the system is also influenced by the emitter selection.Therefore, the emitter should be selected prior to the initiation of the system design.Changing the emitter choice after completion of the design could degrade the system.Proper selection of emitter enables using smaller diameter laterals, longer laterals or less sub-main lines which means less costly system while maintaining the desired system uniformity and efficiency.
To help you select the appropriate emitter, a discussion of emitters flow characteristics are presented followed by a description of some of the commonly used types of emitters.A guideline for emitter selection is then provided.
Emitter Flow Characteristics
Drip emitters regulate water flow by dissipating the flow energy through frictional resistance.Laminar flow emitters regulate water flow by dissipating energy via friction against the walls of long and narrow path.Microtubes and spiral path emitters are examples of laminar flow emission devices.
On the other hand, turbulent flow emitters regulate water flow by dissipating energy by friction against the walls of the water passage and also between the particles themselves during their turbulent movements.Orifices, nozzle emitters, tortuous path emitters and jets or sprayers are typically turbulent emitters.The drip tapes that utilize orifices are also turbulent flow devices.
Laminar Flow Emitters
In a laminar flow the fluid particles move along parallel paths in layers or laminas.The magnitude of the velocities of adjacent laminas is not the same and liquid viscosity (i.e., resistance to poring) is dominant in controlling liquid movement and suppresses any conditions that may cause turbulence.
Hydraulic investigations showed that in a laminar flow, the flow rate “Q” of the emitter is directly proportional to the operating pressure and a change in operating pressure will produce an equal percentage of change in flow rate, i.e., if (H1/H2) = 1.1, then (Q1/Q2) = 1.1, and a change of 10 percent in operating pressure would result in a change of 10 percent in flow rate.
Therefore, the flow rate through laminar flow emitters is pressure sensitive (i.e., less pressure compensating, see turbulent flow emitters below).It is also temperature sensitive since it is influenced by the changes in viscosity of water which changes with temperature, i.e., the higher the water temperature the lower the water viscosity and the larger the discharge rate Q.Laminar flow emitters are also more susceptible to clogging because of their low flow velocity and their relatively long and narrow flow path.However, laminar flow emitters are inexpensive and with proper system maintenance will have satisfactory performance.These emitters are more suitable for short run laterals, where head loss is not very large and flow rate would not suffer large change between emitters.
Turbulent Flow Emitters
In turbulent flow the particles of the fluid moves in a haphazard fashion in all directions.While the viscosity is dominant with laminar flow, both inertia (that property of matter because of which a force must be exerted on a body in order to accelerate it) and viscosity affect the turbulent flow pattern.
Therefore, for turbulent emitters hydraulic investigations showed that the flow rate Q will vary with the square root of the operating pressure H, i.e., Q1/Q2 = [H1/H2]1/2 , and a change in operating pressure H of 10 percent would produce a corresponding change in flow rate Q of only 5 percent, i.e., if[H1/H2] = 1.10, then Q1/Q2 = [H1/H2]x = [H1/H2]1/2 =1.05.Thus, turbulent flow devices are less sensitive to pressure variations (more pressure compensating) than laminar devices, i.e., the same pressure change will produce much smaller change in discharge rate with turbulent flow emitters than with laminar flow ones.
The practical application of this conclusion is that if all other factors being equal, the length of laterals for turbulent drip tape for a given design uniformity could be longer than those of laminar drip tape while maintaining the same desired value of EU.Where the length of the lateral line is fixed (e.g., by field dimensions) the use of turbulent drip tape, for instance, will result in higher uniformity than laminar one due to less flow rate variation with turbulent flow.Hydraulic investigations also showed that the flow rate, Q, with turbulent flow emitters is independent of viscosity and therefore it is much less affected by water temperature than laminar flow emitters.Moreover, the flow path of the turbulent emitters is wider than that of the laminar flow ones which make them less susceptible to clogging than the laminar flow emitters.
Discharge Exponent, x
The exponent “x” mentioned above is usually referred to as the “discharge exponent”.The value of this exponent is usually close to unity (≈ 0.7 – 0.8) for laminar flow emitters and about 0.5 – 0.6 for turbulent flow emitters.
Coefficient of Variation, Cv
Manufacturing variability is a common industrial phenomenon where no two items are made exactly the same particularly for items of very narrow internal passages such as drip emitters.A minute change in the dimension of these passages could make a significant difference in the emitter discharge rate especially the pressure compensating ones.The coefficient of manufacturing variability for the emitter (Cv) is used as a measure of expected variations in discharge of new emitters from the average discharge, qa, of a particular sample of the given emitters when operated at a constant pressure head.Usually, emitter manufacturers provide the values of Cv for their products.
The discharge rate of representative sample of emitters operating at a given pressure essentially follows a bell-shaped normal distribution curve. Where qais the average emitter discharge, approximately 68 percent of the discharge rates fall within (qa ± Cv) , 95 percent of the discharge rates fall within (qa ± 2 Cv), and 99.7 percent of the discharge rates fall within (qa ± 3 Cv).
This means that for Cv values of 10% (0.10)samples of emitters with qaof 1gph, 68 percent of emitter discharge rate would fall within the discharge range of (qa ± Cv) or0.9 to 1.1 gph, 95% percent of emitter discharge rate would fall within the range of (qa ± 2 Cv) or 0.8 to 1.2, and 99.7 percent of emitter discharge rate would fall in the range of (qa ± 3 Cv) or 0.7 and 1.3 gph respectively.
Also for Cv values of 5% (0.05) samples of same emitters. 68 percent of discharge rate would fall within the discharge range of (qa ± Cv) or 0.95 to 1.05 gph, 95% of discharge rate would fall within the range of (qa ± 2 Cv) or 0.9 to 1.1, and 99.7 percent of discharge rate would fall in the range of (qa ± 3 Cv) or 0.75 and 1.25 gph respectively.
Therefore, the smaller the Cv value of a given sample of emitters the less different, or the more uniform, is the sample and the better the emission uniformity (EU) of water in the field.Table 1 provides the ranges and the common evaluations (classification) of Cv values.
Table 1. Coefficient of manufacturer variability, Cv
A higher Cv values, is used for line-source tubing because it is difficult to keep Cv and price both low.However, because line-source outlets are usually closely spaced the effect of higher Cv value on discharge uniformity is minimized.
Emission Uniformity, EU
Emission uniformity (EU) is a critical characteristic around which drip irrigation system is designed.EU indicates how uniform the system applies water in the field.High EU is a prerequisite for high efficiency.Irrigation efficiency could be expressed as how much of the applied water is added to the plant root zone.
It is not possible to acquire high efficiency with low uniformity, EU, because with low uniformity higher percentage of the field area will receive either less water or more water than the average application needed to satisfy the crop water requirements.To remedy this deficiency more water will need to be applied to the field to satisfy the requirements of the under-irrigated parts of the field.This will result in over-irrigating the rest of the field and that means more water is lost away from the root zone resulting in lower irrigation efficiency.
With high EU, only small percentage of the field will be under-irrigated and the volume of water needed to provide for the under-irrigated parts of the field will be much smaller, the losses will be smaller as well, therefore, the efficiency will be higher.However, it is possible to have a low efficiency with high EU.This is not contradictory to what was previously stated that high EU is a prerequisite for high efficiency. For example, if high EU is achieved in a field but excessive amount of water is applied to that field by applying irrigation water for much longer period of time than scheduled for delivering the estimated water requirements of the crop (i,e., over-irrigation) then, large amount of water will be lost away from the root zone and the irrigation efficiency will be low despite the achieved high EU.
Fig. 1. Typical layout of a microirrigated system
B:Types of Emitters
Emitters are usually grouped according to their flow patterns (e.g., laminar and turbulent flow), wetting patterns (e.g., point-source, line-source, multi-exit emitters), and special functions (e.g., pressure compensating and flushing emitters).Some emitters may combine more than one attribute, e.g., pressure compensating line-source emitter (drip tape).
Flow Pattern
* Laminar & Turbulent Flow Emitters
Turbulent flow emitters have the advantage of being less sensitive to pressure variation (i.e., more pressure compensating), less sensitive to water temperature variations, less susceptible to clogging and allow for longer lateral runs or less pressure variation for the same length of lateral run than laminar flow emitters.Laminar flow emitters are less expensive and more suitable for short-run laterals.On-line, in-line and drip tape come in either laminar or turbulent flow type.Both laminar and turbulent flow emitters may come in standard or pressure compensating type.
Wetting Pattern
*Point-Source and Line-source emitter
Drip irrigation with water discharged from emission points that are rather widely spaced, usually 3 ft or more, is commonly referred to as point-source application.When water is discharged from more closely spaced outlets it is called line-source application.Examples of point-source is on-line and in-line emitters (see Fig’s. 2 & 3).The most common discharge rate of point-source emitters is 1 gph.Other available sizes are 0.5, 1.5, 2.0 gph.Point-source emitters come in standard and pressure compensating models.
On-line emitters are commonly used for irrigating orchards and vineyards.The PE (polyethylene) laterals are usually laid on the ground surface (see Fig. 2).This type of emitters offers the user the advantage of installing an emission device exactly where wanted and the emitters are serviceable.Their disadvantage is that the end user must manually insert each emitter.
In-line emitters or drip lines are similar to on-line emitters but in this configuration they are pre-inserted into the PE tubing at specified intervals during the tubing extrusion process (see Fig. 3).The emitters may be cylindrical or flat “boat shaped”, and are attached to the inner tube wall via a controlled heating/adhesion process.Labor savings for the end user may be substantial since emitters are factory pre-installed.The drawback is that emission devices may exist where not needed, and they are not serviceable. Drip-line may be installed below the surface such that the soil surface may be kept dry.Both on-line and in-line emitters come in regular and pressure compensating types.
Examples of line source are single chamber and double chamber drip of relatively thin tubing, commonly known as “drip tapes” (see Fig. 4).Single chamber tubing has orifices punched or more complex emitters fabricated or inserted at intervals of 2 ft or less along the tubing.Double chamber tubing is a hose that has both a main and auxiliary bore separated by a single wall.Widely spaced inner orifices are punched in the separator wall between the main and the auxiliary bore; for each inner orifice, three to six exit orifices are punched at intervals of 0.5 to 2 ft in the outer wall of the auxiliary bore.
Drip tape may be classified according to their flow pattern as either turbulent or laminar.Turbulent drip tape controls flow rate by means of orifices or tortuous flow paths, while laminar tape utilizes small tubes or capillaries to control flow rate.These two types of drip tape exhibit different flow rate response to pressure variation (as explained earlier) and they are not mutually exchangeable for the purpose of system design.
Water is distributed evenly along the length of the drip tape through emission devices that may be spaced anywhere from 4” to 24” apart.Tube wall thicknesses vary from .004” to .015” (4 mil to 15 mil), emitter flow rates from 0.07 to 0.34 gph, and tube diameters from 5/8” to 1-3/8”.Drip tape is used extensively for irrigating vegetable and field row crops e.g., strawberries and tomatoes.It may be installed above or below the ground, and may be retrieved for multi-season reuse or disposed of at the end of each season.Drip tape is relatively inexpensive and is ready to install without any additional emission device installation labor.
*Sprayer, Jets or microsprinklers(see Fig. 7 & 8)
These are small applicators designed to spray water to cover an area of 10 to 100 ft2.Jets are mounted on risers or stakes (see Fig. 8) and spray water through the air as separate streams that create various foot printpatterns of water in the soil.A variety of patterns are available including full circle, half circle, hi/low trajectory, butterfly, etc.The versatility of patterns provides a great deal of flexibility for the end user to accurately apply water only where wanted, such as enveloping each tree in an orchard without wetting the trunk.Wetted diameter ranges from 10 to 35 ft and discharge rate from 5 to 30 gph.Flow through jets is turbulent with discharge exponent x = 0.5.Jets are commonly used on orchard crops like almond and citrus and on light textured soils.
Special Function
*Pressure-Compensating Emitters
This type of emitters provides varying degree of flow regulation with discharge exponent “x” value ranging from 0.0 to 0.4.For complete flow regulation x = 0.0.Pressure compensating devices may be either laminar or turbulent.In either case, these devices utilize the inlet pressure to modify the flow path size, shape or length.In this way, pressure-compensating devices are able to deliver the correct flow rate over a fairly wide range of inlet pressures, and within that range their flow rates are relatively constant.Pressure-compensating emitters are useful for use in undulating fields.
Pressure compensating emitters suffer from the drawback that the elastomeric material used in their construction has a tendency to change their properties as they age. The following graphs (Fig’s. 9 & 10) show the difference in performance between pressure-compensating and non pressure-compensating emitters.
*Flushing Emitters
This type of emitters is designed to have a flushing flow of water to clear the discharge opening every time the system is turned on.Continuous flushing emitters permit continuous passage of large solid particles whileoperating.Some on-line emitters and drip tape are manufactured with flushing capabilities.
*Multi-Exit Emitters(see Fig. 6)
Some on-line emitters supply water to two or more points through small diameter auxiliary tubing; they are used in orchards where large trees may require several emission points for each tree.They are usually more expensive than single exit emitters.
E.A Guideline for Emitter Selection
The pressure variation within the system and the flow characteristics of the selected emission devices influence the uniformity of water distribution (EU) of a drip/microirrigation system.While the control of pressure variation by proper system design is certainly required, the selection of the emitter device itself is also vital for achieving the desired high EU and high system efficiency (e.g., x & Cv).Moreover, emitter selection is critical for specifying the water treatment and the filtration equipment for the drip system.Filtration requirement for a given emitter is specified by the emitter manufacturer.User preference might also be a factor and personal and local experience may influence the choice of emitter.
However, two very important items to be considered in emitter selection are the percentage area wetted, which is related to delivering the required amount of water to the plant at the design pressure, and the reliability of the emitter against clogging and malfunctioning.
It is recommended to provide a sufficient number of emission points to wet between one-third and one-half of the horizontal cross sectional area of the potential root-zone.Field observations have shown that the density of emission points required to obtain such percentage of wetting can be based on an assumed discharge of 1 gph emitters.For perennial crops, the number of emitters can be increased with the age of the plant and stage of growth.However, the initial pipe network must be designed to meet the needs of the mature plants.It is usually recommended that the filtration process should remove all particles larger than one-tenth the diameter of the emitter passage way.Also, regular flushing of laterals can significantly reduce emitter clogging (see Fig. 11).
Conclusion
Generally, the selection of an emitter depends on the soil to be wetted, plants to be grown and their water requirements, quality of irrigation water and emitter discharge. The cost ofemitter should be also be considered as the average total cost of emitters may amount to about 20-25 percent of the total cost of the system.The following points together with above provided explanations may provide a guideline for emitter selection.
First determine the general type of emitter that best fits the needs of the crop to be irrigated and the area to be wetted, i.e., continuous wetting pattern for vegetable crops where a drip tape could be suitable, on-line emitters for irrigating orchard crops,jets where relatively coarse textured soil prevails or where light water applications with large foot print could be more suitable for the crop requirements.The use of pressure compensating emitters may be advantageous for undulating terrain.
Second, according to the required discharge, spacing, and other field conditions, choose the specific emitter needed, i.e., which drip tape, jet pattern, or on-line emitter could be more fitting for supplying the water requirements of the crop, e.g.,for drip tape, is it going to be for one season, 4 mil, or for several seasons, 25 mil.Third, determine the required discharge (q) and operating pressure head (H) for the average emitter that fits the system design and prevailing conditions (e.g., water quality, soil properties, weather conditions).
It is also important to examine the emitter characteristics described above i.e., x, Cv, filtration requirements.Emitters with discharge exponent (x) closer to 0.5 is more pressure compensating, less sensitive to temperature changes and less susceptible to clogging than the ones with the value of x closer to one. The smaller the Cv value for the emitter the more uniform is water application in the field.Emitters with Cv between 0.03 to 0.05 are expected to provide higher EU and consequently higher system efficiency than the ones with Cv between 0.07- 0.09.
Filtration requirement as stated by the emitter manufacturer should also be considered, the smaller the required mesh number (number of opening per inch) the less susceptible the emitter to clogging.Emitters that require mesh number 160 is less susceptible to clogging than the ones that requires 260 mesh number for filtration.However, the filtration requirements as stated by the emitter manufacturer should be fulfilled.Also, enquire with emitter manufacturers regarding the tolerance of emitter components to chemicals such as acid and chlorine usually used for system cleaning and disinfection.Finally, local and personal experience should be taken into consideration.
For more information, visit www.agridrip.com or contact F.A.Hassan, an irrigation & Soils Consultant at Agro Industrial Management at “fahassan@aol.com“
With the largest pistachio crop ever in the west last year coupled with international trade issues, some might be concerned about prices and how to move such a large inventory; however, American Pistachio Growers (APG) reported that the demand is out there at their annual conference, and APG unveiled some exciting new marketing plans for the coming year, including a new market in India. Watch this brief interview with Judy Hirigoyen from APG, and read more about it in Pacific Nut Producer Magazine.
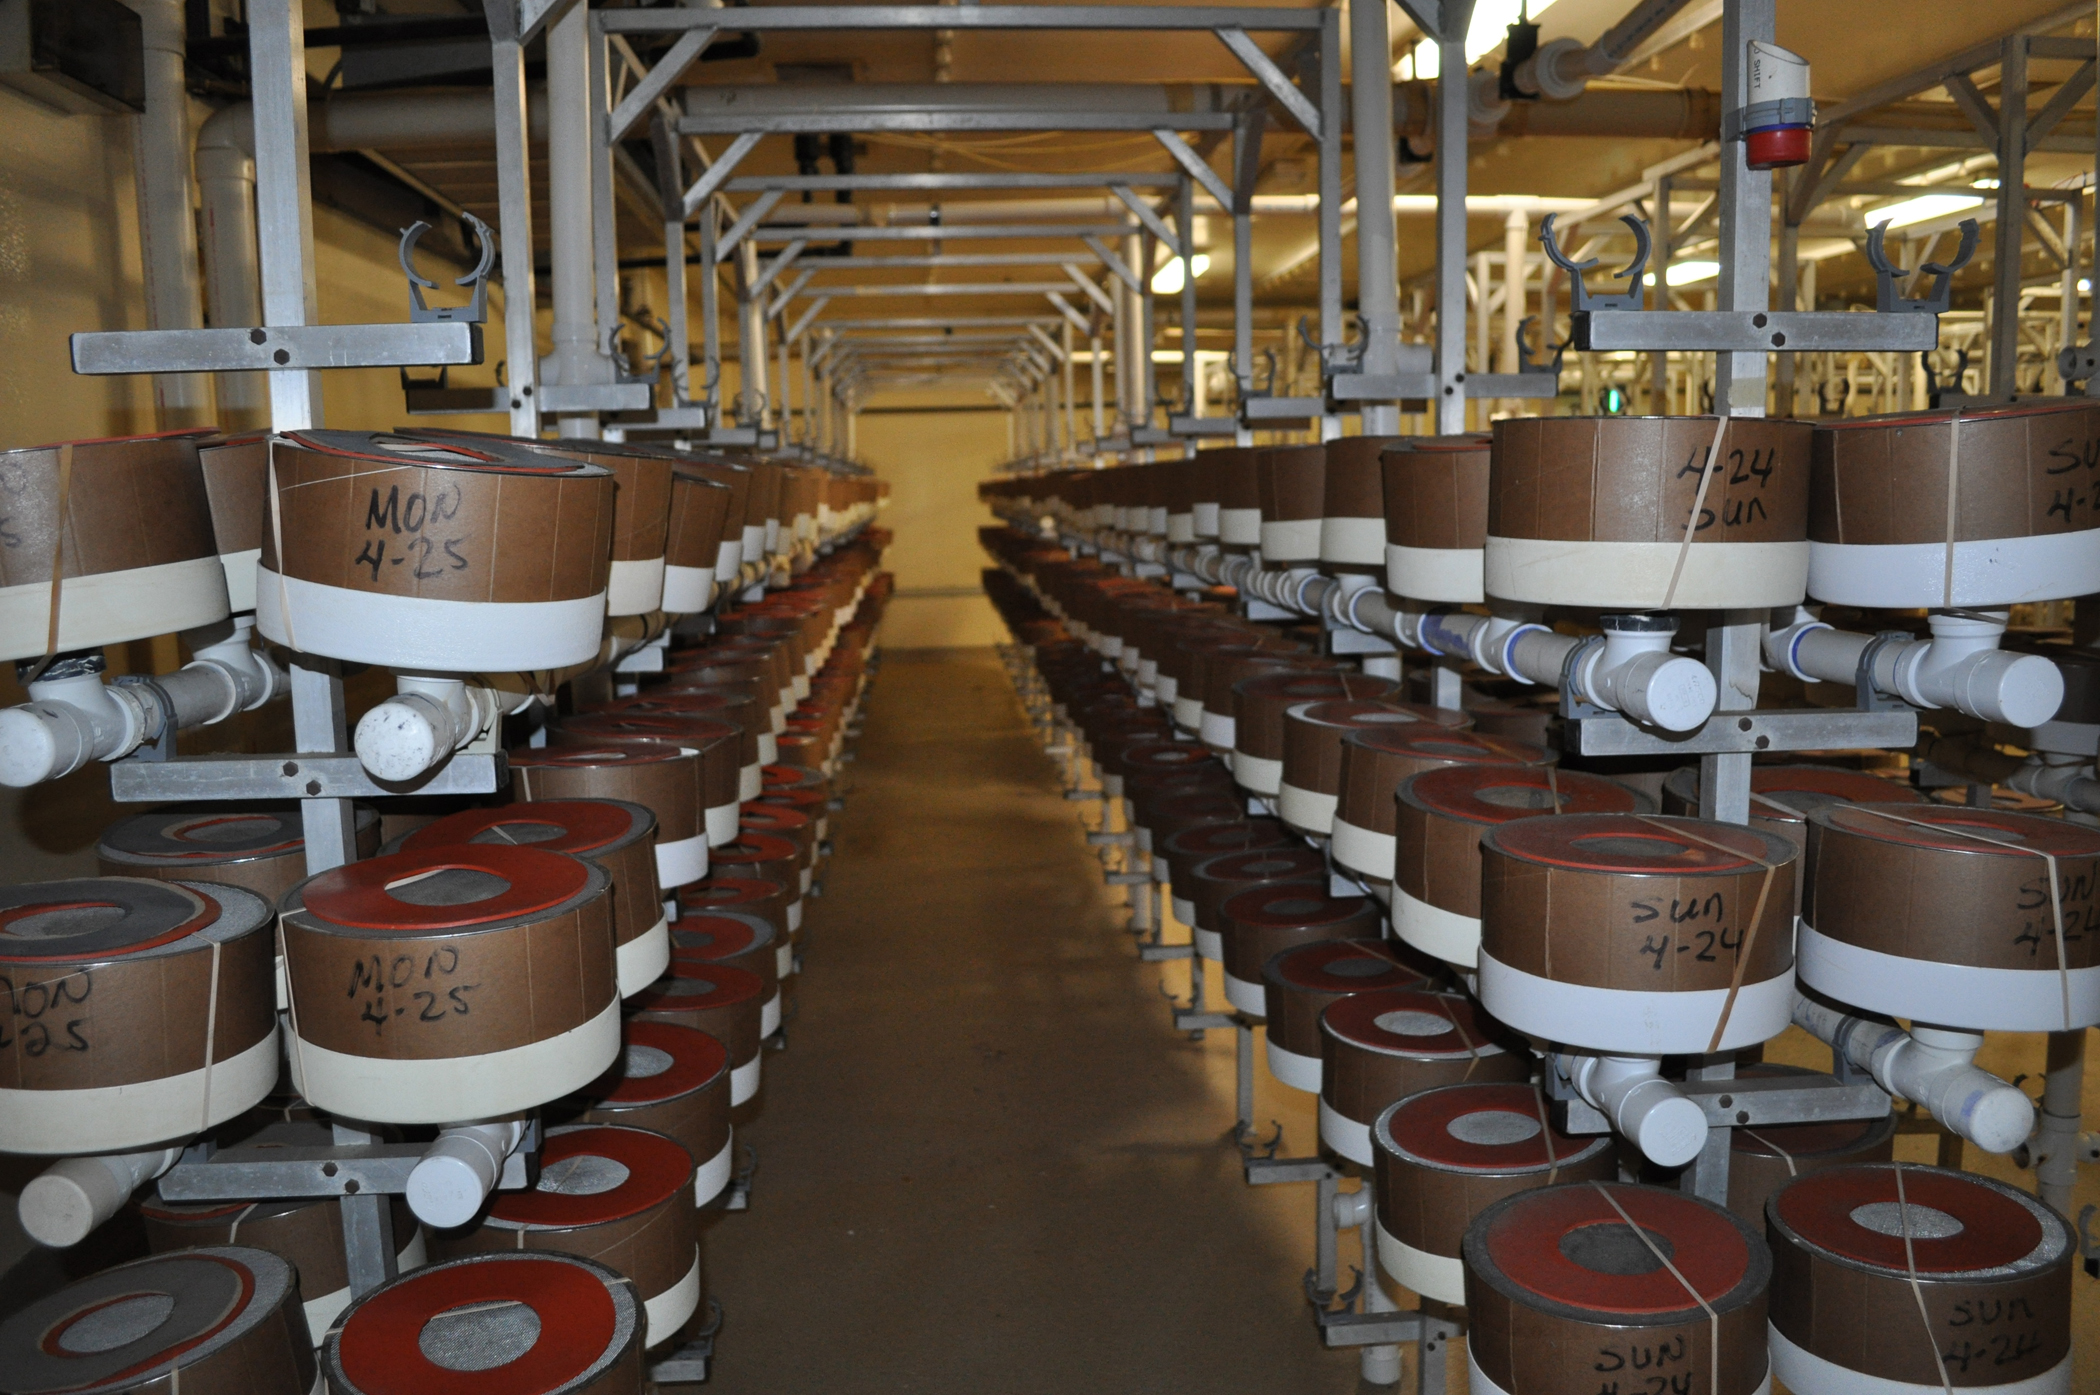
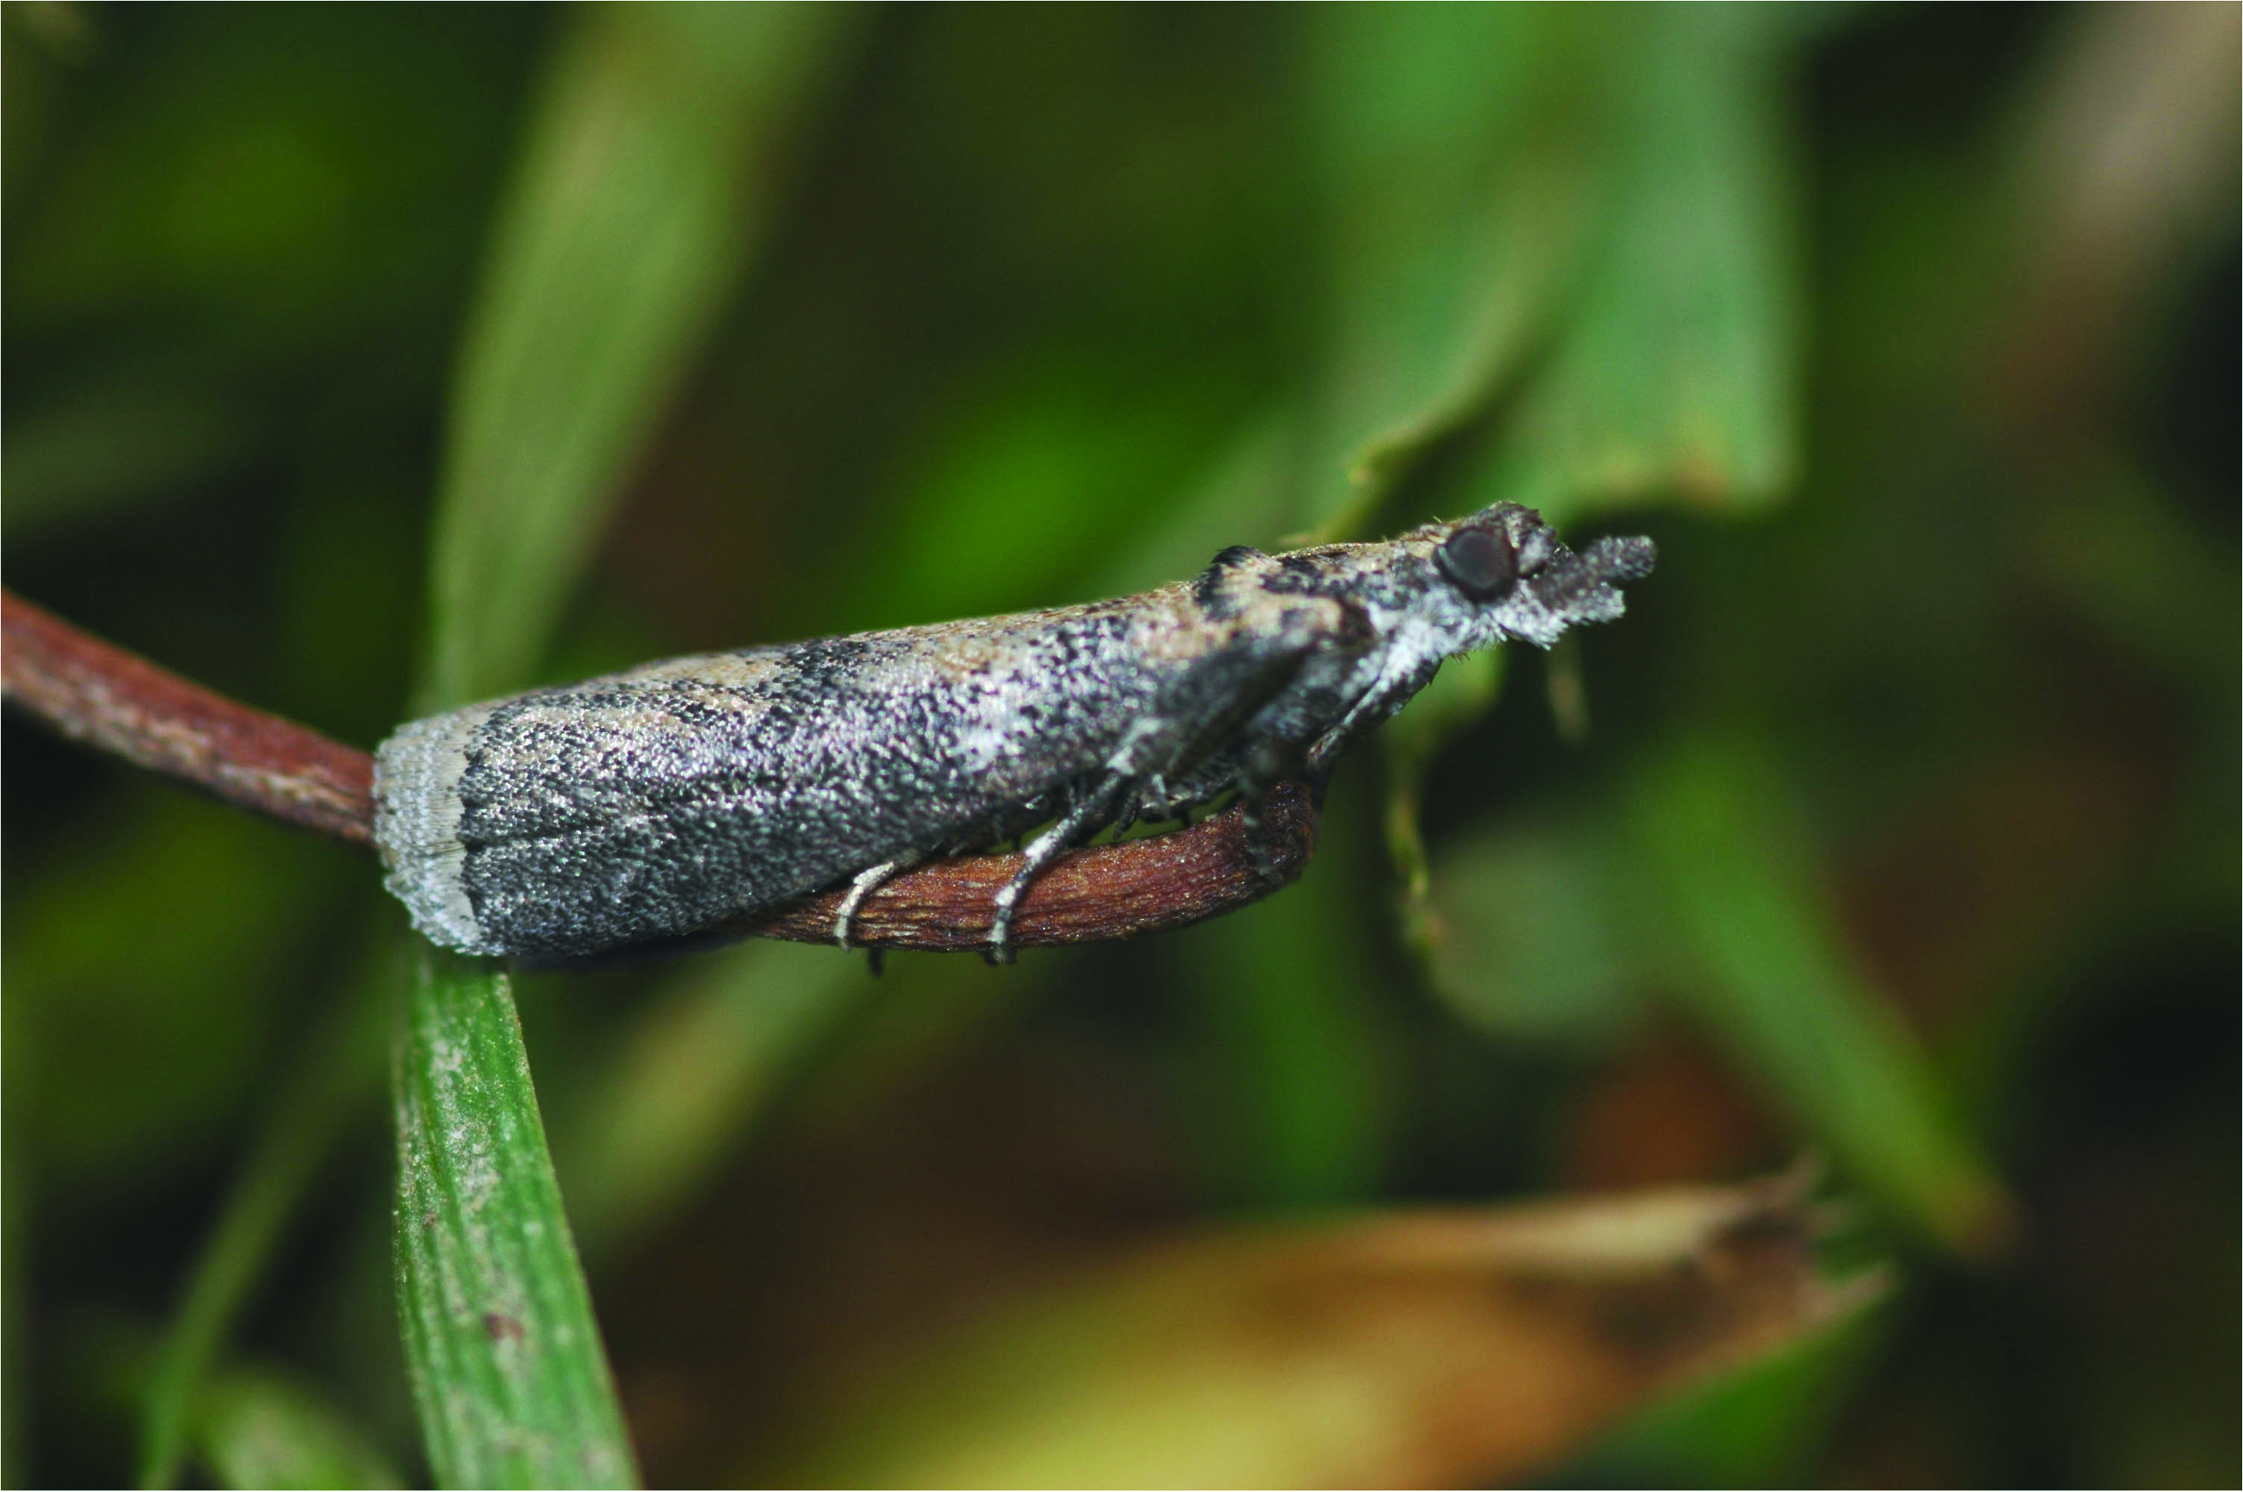
Researchers and growers are tackling the formidable tree nut pest Navel Orangeworm from all fronts. One method underway is in utilizing the same sterile insect technology and facility that eradicated pink bollworm from the cotton industry years ago. There have been some challenges in adapting the system for Navel Orangeworm, as shared by Bob Klein from the Pistachio Research Board; however there is great potential for this program to aid growers in managing this pest. Watch this brief interview with Bob and read more about it in Pacific Nut Producer Magazine.
Navel Orangeworm has become a serious pest in California for many agricultural commodities, especially for tree nuts. Mating disruption technology has proven to be a critical tool in managing this pest; however some growers may have concerns with utilizing this technology on their farms. Check out this brief interview with Brad Higbee, now Field Research & Development Manager for Trece, Inc. as he works with growers to overcome concerns and clear up any misconceptions regarding this novel technology in the nut industry.
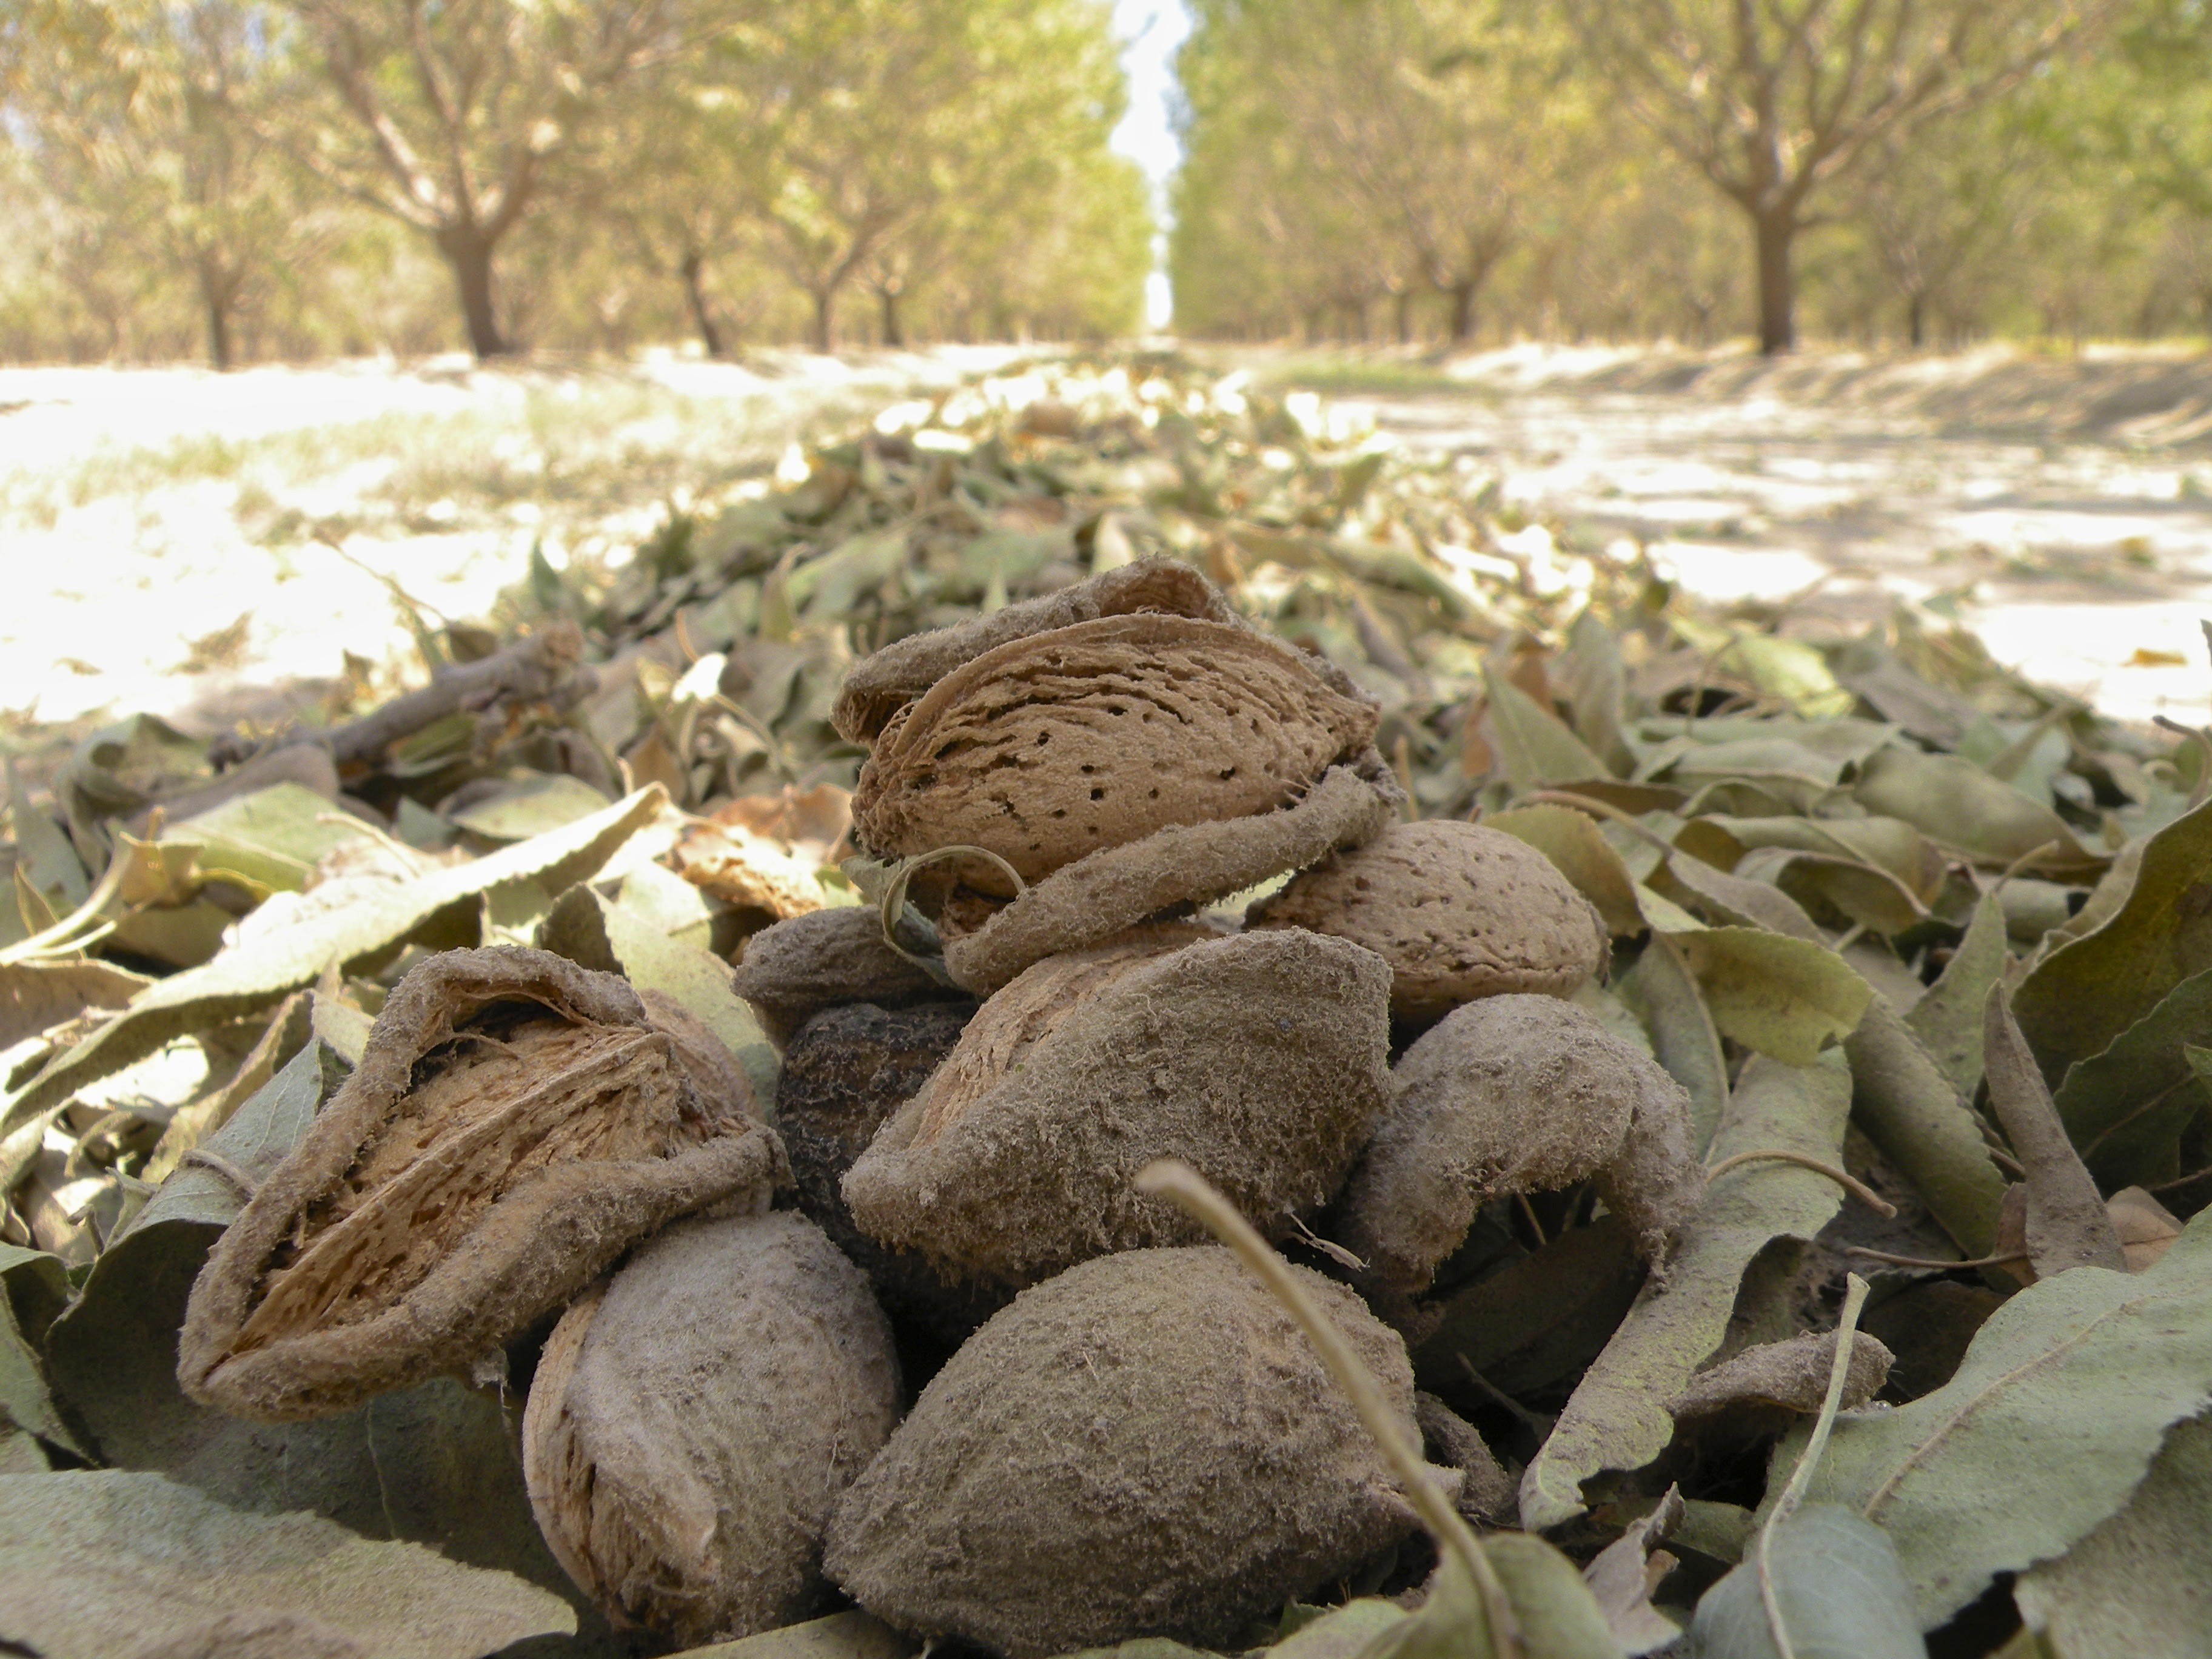
USDA’s National Agricultural Statistics Service (NASS) reports that California’s almond acreage continued to increase in 2018. Bearing acres, or orchards that have matured enough to produce a crop, are reported at 1.09 million acres, which is up 6 percent from 2017. Total almond acres for 2018 is estimated at 1.39 million acres, up 2 percent from the previous year.
With this increase, almond growers remain committed to continuous improvement, finding ways to responsibly produce more almonds to meet global and domestic demand (30% of total shipments of California almonds are shipped domestic). Last year, the Almond Board of California (ABC) Board of Directors prioritized industry resources in four key areas that will ensure almonds remain as leaders in California agriculture as they work towards producing an economically, environmentally and socially responsible crop. These four key areas – water use, harvest dust reduction, environmentally friendly pest management, zero waste – ladder up to the Almond Orchard 2025 Goals, whichbuild upon a history of significant industry achievements. For example, over the past two decades growers have reduced the amount of water it takes to grow a pound of almonds by 33%.
In addition to achievements in the orchard, on the processing side there have been zero outbreaks of foodborne illness attributed to California almonds since the rollout of a groundbreaking pasteurization program a decade ago. In fact, earlier this month the Almond Board was selected to receive the GMA Food Safety Award from the International Association for Food Protection, in recognition of the Board’s “preeminence in and contributions to the field of food safety.”
“The California almond industry continues to prove itself as a leader in responsible practices, from the orchard to the processor,” said Almond Board President and CEO Richard Waycott. “The Almond Orchard 2025 Goals act as a guidepost on our journey towards continued advancement and innovation throughout the industry. With the latest acreage numbers, we’re confident in our ability to continue to meet global demand and to provide the world with a high-quality product.”
On Friday, May 10, 2019, NASS will release the 2019 Subjective Report, which provides an initial forecast of the upcoming crop. Data for the Subjective Report is based on opinions obtained from almond growers in a survey sent by NASS. Almond growers will soon receive the NASS survey and are encouraged to participate. For more information, growers may contact Bryce Spycher at bspycher@almondboard.com.
About the Almond Board of California
California Almonds make life better by what we grow and how we grow. The Almond Board of California promotes natural, wholesome and quality almonds through leadership in strategic market development, innovative research, and accelerated adoption of industry best practices on behalf of the more than 6,800 almond farmers and processors in California, most of whom are multi-generational family operations. Established in 1950 and based in Modesto, California, the Almond Board of California is a non-profit organization that administers a grower-enacted Federal Marketing Order under the supervision of the United States Department of Agriculture. For more information on the Almond Board of California or almonds, visit Almonds.com or check out California Almonds on Facebook, Twitter, Pinterest,Instagram and the California Almonds blog.
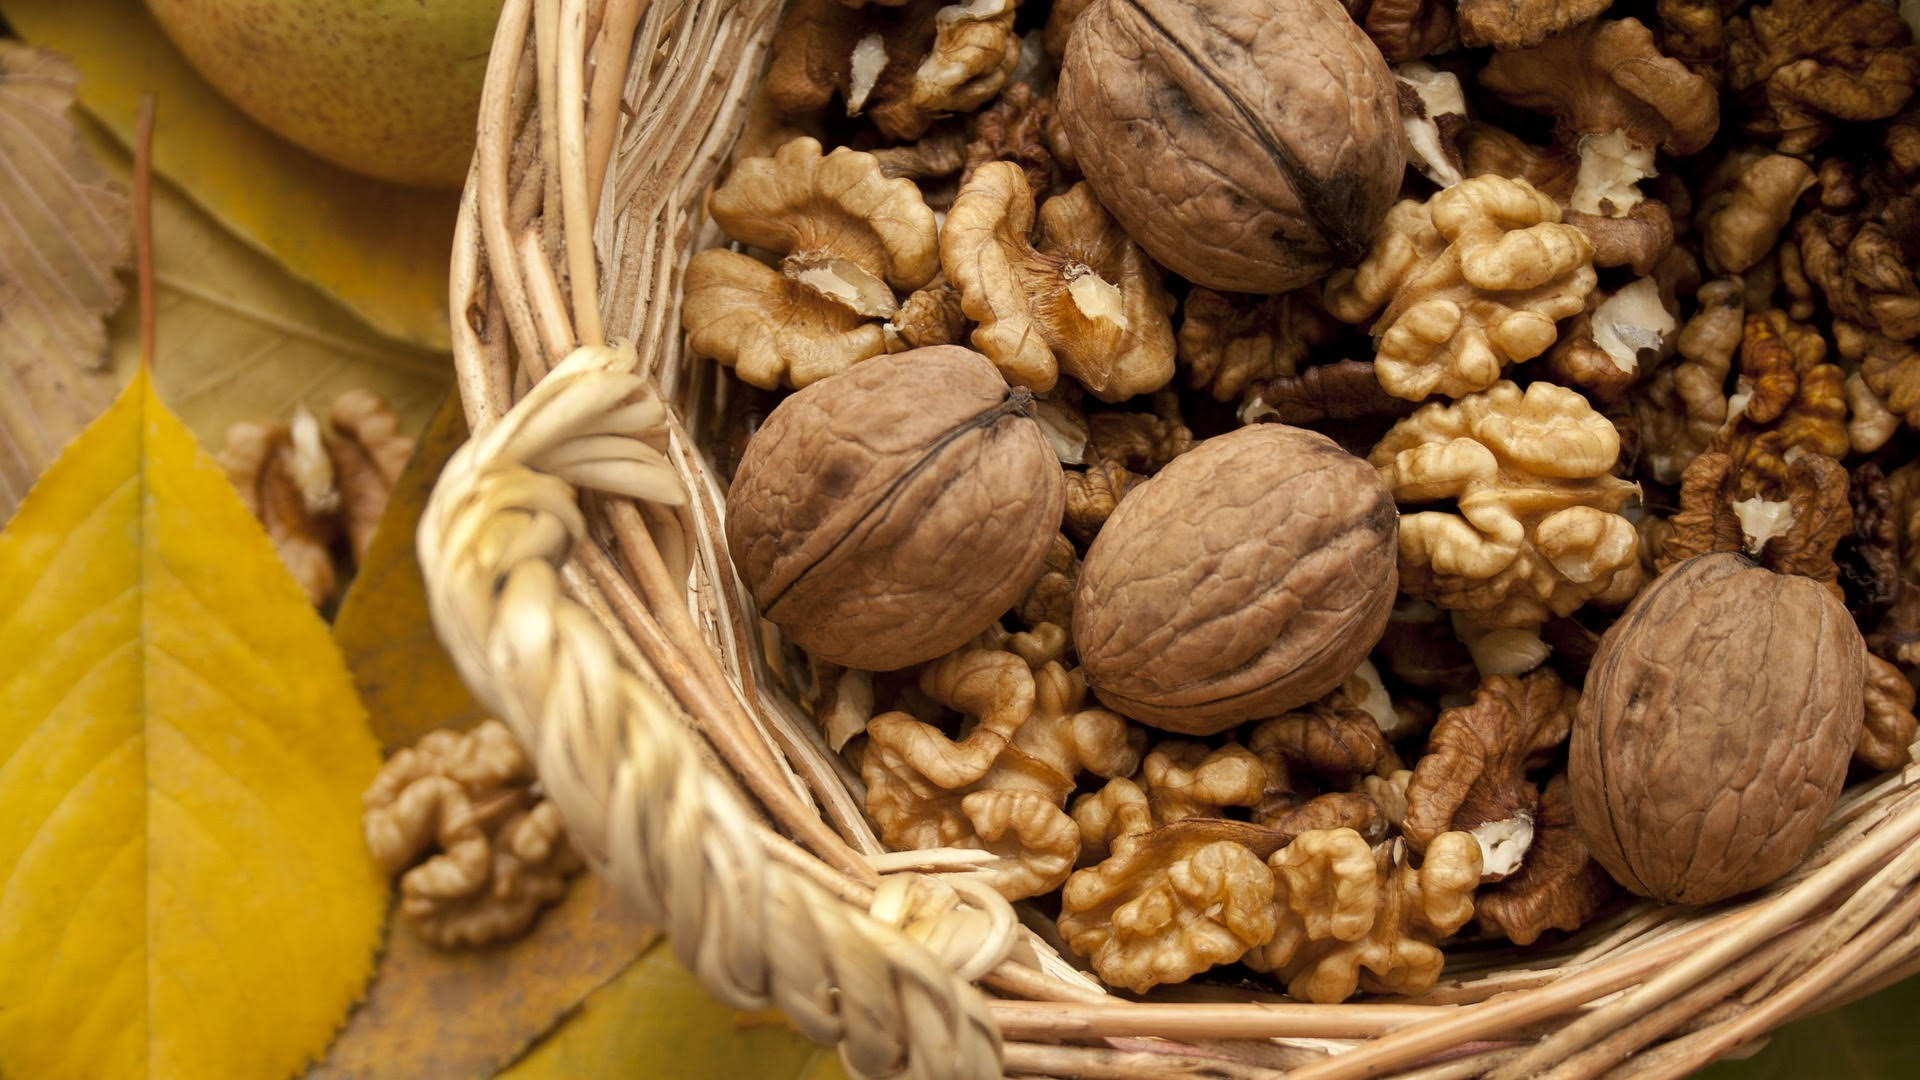
This year the California Walnut Commission will be holding elections for members and alternates for the term beginning September 1, 2019 and ending August 31, 2021.
“The diversity of our growing and evolving membership brings valuable perspective to industry. The CWC in partnership with the United States Department of Agriculture (USDA) welcomes participation of women, minorities and people with disabilities,” said Michelle McNeil Connelly, CEO of the California Walnut Commission.
Following are the specifications for the election:
Every two years the Commission law provides for the nomination of 13 members and 13 alternates that will be appointed by the California Secretary of Food and Agriculture.
The following is a list of the member and corresponding alternate positions for the Commission:
Eight Producer Members (four from each district, see below)
Four Handler Members
One public member (nominated by 12 elected members)
All producers and handlers participating in the election must complete a nomination form in order for their name to appear on the ballot. The nomination period is May 1-31. All producer candidates must return the form with at least 15 eligible grower signatures. All handler candidates must submit a petition with at least five other handler signatures.
We anticipate that ballots will be mailed to growers and handlers in late June. The election results will most likely be announced in August.
District 1 is comprised of counties in the state that lie north of a line drawn on the south boundaries of San Mateo, Alameda, San Joaquin, Calaveras and Alpine counties.
District 2 consists of all other walnut producing counties in the state south of this boundary line.If you have any questions please feel free to call the CWC office at (916) 932-7070.
About California Walnut Commission
The California Walnut Commission, established in 1987, is funded by mandatory assessments of the growers. The Commission is an agency of the State of California that works in concurrence with the Secretary of the California Department of Food and Agriculture (CDFA). The CWC is mainly involved in health research and export market development activities. For more industry information, health research and recipe ideas, visit www.walnuts.org.
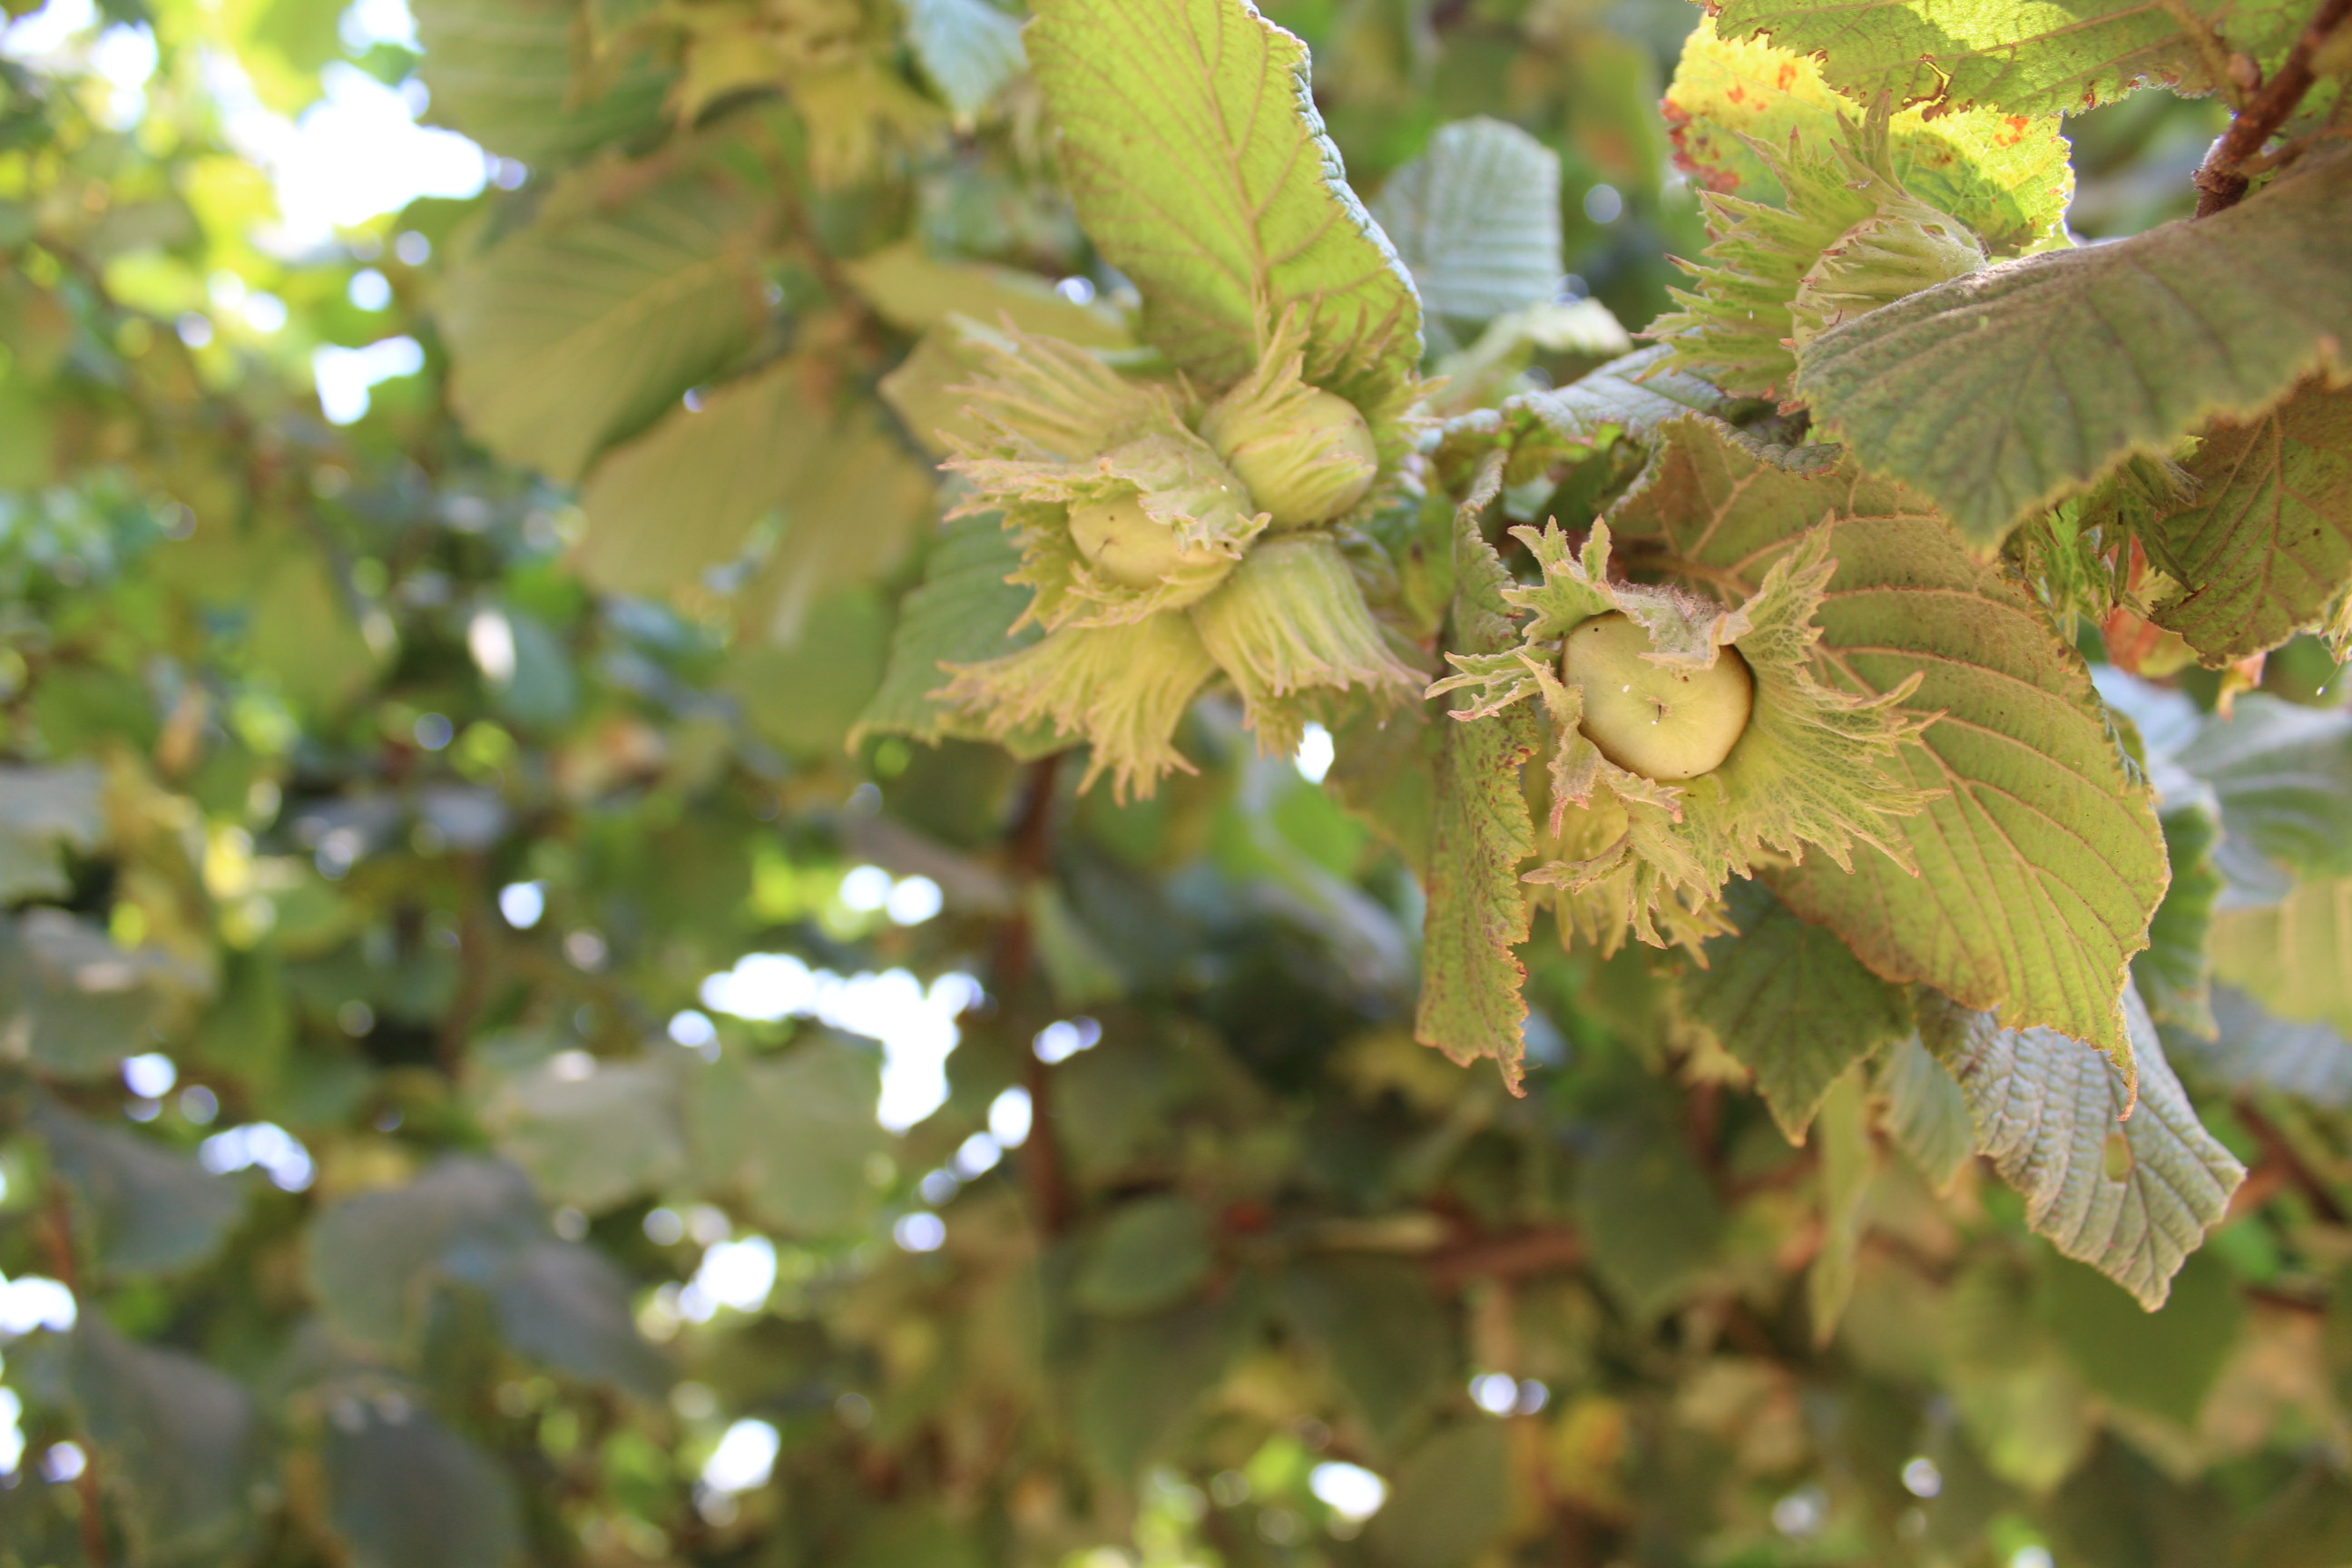
Oregon State University just released their 2019 updated hazelnut pest management guide for growers in the Willamette Valley, including pesticide and fungicide use guidelines (products, rates and application timing).
The chemicals, formulations, and rates listed for insect, mite, and disease control are among the best recommendations based on label directions, research, and orchard use experience. Only a thorough knowledge of the orchard, cultivar, tree size and density, canopy characteristics, pest complex, and past pest problems will enable you to correctly select chemicals, rates, water volume, and method of application for optimum pest control. Occasionally, different formulations of a product or like formulations containing a different amount of active ingredient also are registered and effective for use on the pests listed. These products also may be used; we do not intend to discriminate against them. You may wish to consult their labels and determine whether their use confers advantages over the products listed in this guide.
Always refer to the pesticide label as the legal document guiding product use. Two questions frequently asked about chemical control of insects and diseases are: “How much chemical do I use per acre?” and “What is the least amount of water I need to apply per acre?” The tables below suggests an amount of formulated product (not active ingredient [AI]) to use per acre. This amount is based on a “typical” middle-aged and density orchard with moderate pest pressure. It takes less spray to get good coverage on an orchard with immature trees with limited canopy, but this does not affect the rate of application by volume. For most ground-applied applications, apply products in a minimum of 100 gallons of water per acre (GPA). For larger canopies, 150 to 200 GPA of water can improve coverage and efficacy. Always calibrate sprayers to tree size to improve coverage, reduce waste, and avoid drift. Please be aware of recent regulations governing the application of pesticides outlined
in the EPA Worker Protection Standard (WPS), particularly the Application Exclusion Zone (AEZ), which is enforced by Oregon OSHA. Apply pesticides judiciously and promote good relationships with neighbors. Read more Here.







 This year the California Walnut Commission will be holding elections for members and alternates for the term beginning September 1, 2019 and ending August 31, 2021.