Category: Featured Post

  • Bulgarian Tree Nut Market Sees Rapid Expansion

    Bulgarian Tree Nut Market Sees Rapid Expansion

    The Bulgarian tree nut market expanded rapidly in marketing year (MY) 2024/25, and the MY 2025/26 forecast is optimistic. There was a significant boost in consumption and trade, driven by both retail sales and the confectionary industry. Decreasing food inflation, improving incomes, and strong development in tourism/travel supported consumption growth. Domestic production increased to meet dynamic demand but still had a small market share. Expectations for MY 2025/26 are for lower local supply and higher imports while consumption is projected to maintain its gradual increase. In MY 2024/25, the United States maintained its leading role as a key supplier, with double digit growth in Bulgarian imports of U.S. tree nuts to about $20 million, or a 43-percent growth over MY 2023/24 ($14 million).

    However, U.S. exporters are facing increasing competition from price-competitive imports of walnuts (Ukraine and the People’s Republic of China) and of peanuts (Argentina and Nicaragua).

    Overview

    Bulgarian tree nut production (almonds and walnuts) is inconsistent – with regular major fluctuations in production depending on weather conditions. Harvested area is usually less than planted area as lowcyield often makes harvesting cost ineffective.

    Consumer demand increased considerably in MY 2024/25, driven by lower inflation, improved income, and stronger tourism. Retail sales, especially at specialized snacks-and-nuts retail outlets, proved to be highly popular and profitable. Official statistics data (National Statistics Institute) indicates that nut consumption per capita in calendar year (CY) 2024 grew by 12.5 percent to 1.8 kilograms (kg), from 1.6 kg in CY 2023. This follows double digit growth in the previous year (GAIN BU 2025-0002). On average, Bulgarian households purchased 3.5 kg in 2024 compared to 2.7 kg in 2023 or 30 percent more at an average price of 9.46 Euro/kg in 2024 compared to 8.45 Euro/kg in 2023 – a12 percent higher price. As this data is only for retail sales and does not include consumption in the food service industry or processing, actual market consumption is higher. The trend has reportedly continued into the current marketing year.

    Tree Nut Supply and Demand for MY 2024/25 and Estimates for MY 2025/26

    Production

    Bulgaria has good climate conditions for tree nut production (almonds, walnuts, peanuts, and hazelnuts). The country produces a small quantity of almonds for the domestic market only. In the past, Bulgaria produced enough walnuts to meet its consumption and export small quantities in the region.

    In MY 2024/25, almond production saw significant growth – reaching 1,140 metric tons, (MT) its highest level since 2019, and 83 percent more than in the previous MY (Table 1). This growth was due mainly to a much higher harvested area – 71 percent more than in MY 2023/24, as well as 7.4 percent higher average yields. The share of harvested area of planted almonds increased from 41 percent in MY 2023/24 to 72 percent in MY 2024/25. This was a notable change after years of decline (Table 1, Graph 1). However, production was still below the record achieved in 2018 (1,286 MT). Reportedly, higher almond prices motivated producers to invest in better harvesting practices.

    Walnut production also increased to 4,240 MT, 23 percent more than MY 2023/24. However, this growth was due mainly to better average yields of 22 percent, while the harvested area expanded by less than 1 percent. The share of harvested area to planted area saw small growth, from 57 percent to 59 percent (Table 1, Graph 2). See GAIN BU 2025-0002 regarding production regions and age structure of orchards of almonds and walnuts. Due to an ongoing decline in subsidies for new orchards, the size and share of young orchards for both almonds and walnuts continued to shrink (Table 1).

    In MY 2024/25, average tree nut yields increased due to more favorable weather in different production regions. Almond yields increased by 7.4 percent and walnut yields by 22 percent, compared to MY 2023/24. Product quality also improved compared to the previous year.

    Organic tree nut production is not significant. Certified organic areas declined by 2 percent from 8,396 HA in 2023 to 8,235 HA in 2024. Organic tree nut production in 2024 grew by 41 percent to 1,614 MT compared to 1,144 MT in 2023. Total tree nut supply increased significantly to 5,380 MT by 32 percent over MY 2023/24 (4,072 MT) (Table 1). This had an impact on trade by reducing import needs despite booming demand.

    In MY 2025/26, based on the available area harvested and yield data (Ministry of Agriculture/MinAg and industry information), almond and walnut production are expected to decrease significantly, following sharp growth in MY 2024/25. The MinAg does not track almond production on a weekly basis and FAS Sofia estimates for production, supply, and demand for MY 2025/26 are based only on industry information (Table 2). Bulgaria’s severe 2025 summer drought is the main cause of this projected decline in production.

    Almond production is estimated to decrease to about 650 MT, a level seen two years ago, mainly due to reduced yields. For walnuts, the latest MinAg weekly bulletin (MinAg Bulletin #1, January 15, 2026, tentative data) reports walnut harvested area to be 52 percent lower, with average yields decreasing by 30 percent, leading to a 67 percent reduction in production compared to MY 2024/25. Based on this data and industry information, FAS Sofia forecasts walnut production to slide downward to 3,500 MT in MY 2025/26. These production estimates are subject to revision upon availability of final tree nut harvest data. The estimated decline in domestic supply will likely motivate higher imports.

    Consumption and Consumer Preferences

    Bulgarian consumer demand for tree nuts has strengthened in recent years. The Bulgarian retail market for nuts (tree nuts, peanuts, seeds, and trail mixes) in CY 2024 was valued at 134 million Bulgarian leva/BGN ($74 million) and at 138 million BGN in CY 2025 ($80 million). According to industry estimates (Euromonitor), the retail market is expected to grow to 161 million BGN ($92 million) by 2030. The average annual growth rate between 2025 and 2030 is projected at around three percent. In volume, retail market sales are estimated at 5,800 MT-6,000 MT. Food service sales are much smaller, (under 1,000 MT). The rest of consumption goes for industry use/processing and production of confectionary products (Tables 2 and 3).

    Tree nut retail sales have been boosted by a stronger consumer focus and improved awareness of a healthier lifestyle and diet. Consumers are increasingly interested in product innovations, new flavors, and nut blends. The local retail market is dominated by a few market players who are expanding the assortment of nuts: emphasizing consistently high quality, adding value by new flavors and processed nuts products. Most specialized nuts retail outlets add quality and/or organic condiments, dried fruits, beverages (tea/coffee and soft drinks), and snacks as side products which sell well with nuts. Please, see GAIN BU 2025-0002.

    A recently retail market survey on the tree nut market for 2024 shows that the product category of roasted tree nuts generated annual growth of 10.4 percent in sales (value) as a result of 8.4 percent higher prices and 1.9 percent higher sales volume. The main factor driving the roasted nut market is less expensive prices compared to raw nuts. In addition, there was increased demand in the larger size packages offered in this segment – 250 grams (g), 500 g and 1 kilogram. Raw nuts, on the other hand, had 11.6 percent sales growth in value, driven by an 8.7 percent price growth. The preferred size packages were 70 g and 80 g, which sold the fastest due to the lowest price increase for this size. Private label sales for both types of nuts grew in double digits, driven by lower prices and consumer demand.

    Roasted nuts had a market share of 16 percent in volume and raw nuts had a market share of 40 percent. Peanuts were the most popular choice among processed nuts. Peanuts had 35 percent market share in sales in volume, nut mixes 9 percent, cashews 5 percent, almonds 3 percent, pistachios 3 percent, and other types of nuts were at 8 percent.

    In 2024, 212 new products were launched on the market in the “Processed (roasted) nuts” category. Thisvincluded 25 new products under peanuts segment, 13 percent in nut mixes, 7 percent in cashews, and 6vpercent in almonds and pistachios.

    Nut mixes or nut and fruit mixes remained the most important for raw nuts category. Data shows a 9 percent drop in the price of nut mixes and an 8.7 percent increase in the average price of raw nuts, driven by the change in the price of hazelnuts. For the raw nuts market (volume), the shares of different categories were the following: nut and fruit mix 29 percent, cashew 15 percent, almonds 14 percent, walnuts 12 percent, nut mix 9 percent, and other 13 percent. Raw nuts contributed to the development of the category with 44 new products, with the largest share of innovations being represented in almonds and walnuts (18 percent), pumpkin seeds, nut and fruit mixes (14 percent), sunflower seeds (7 percent), and peanut and nut mixes (7 percent). The focus was on larger size/weights.

    Successful marketing strategies included promotional activities around holidays. Snacks with healthy and functional ingredients, such as those high in protein and fiber, and low in calories and sugar, were leading. Innovative flavors brought new sensory experiences to consumers. Good positioning of these products on social networks was key to positive sales development. Promotional activities remained key for the nuts category, as the right strategies and positioning contributed to a significant increase in sales.

    The market share of the three top companies (Detelina, Victoria Nuts, and Elit) increased from 43.6 percent in 2024 to 43.8 percent CY 2025. The next five companies, Kronos, Dani, Kerpi, Milena-Hristo Hristov ET, and Ivtoni Shopov Ltd. accounted for 29.7 percent of the national market. Small companies (1 to 3 percent share each) jointly accounted for 26.8 percent in 2024 compared to 26.5 percent in 2025 (source: Euromonitor). Some players such as Yadki Nachev, Mr. Almond, Nuts Bg and Top Foods, combined specialized retail outlets for high-end, quality nuts with online sales and make efforts to expand their portfolio with plant based products such as almond milk, protein snacks and other.

    In MY 2024/25, there was more demand for tree nuts from both direct consumption and for processing in the confectionary industry. Improved local supply and quality of tree nuts led to slightly lower imports in volume. Despite higher market prices and local consumers being price sensitive, consumption is estimated to increase. Consumption estimates are based on FAS Sofia interviews with trade sources and statistical data on consumption patterns.

    Almonds: Domestic consumption has steadily grown in recent years due to the excellent image of almonds as nutritious, healthy, and quality snacks. FAS Sofia estimates almond consumption has increased by about 2 percent in MY 2024/25 and reached 3,230 MT, marking a new record. This increase also continued growth over the last 5 years. Imports accounted for about 80 percent of total supply (Table 2) despite 22 percent higher import prices negatively affecting consumption. Industry sources note growth in consumption could have been stronger if almond prices were not sharply higher.

    Travel, tourism, and hospitality outlets continued to support growth in consumption. Traders report local demand by the confectionary industry has improved (Table 2, Graph 3). FAS Sofia forecasts slightly higher almond consumption in MY 2025/26 with growth up to 2 percent (in volume) due to continuing price increases (see the Trade Section).

    Walnuts: Walnut consumption in MY 2024/25 saw greater growth than almonds and is estimated to have reached a new record of 10,864 MT, or 44 percent more than in the previous MY. This was due to better local production and a very significant 71 percent increase in imports. Imports accounted for 66 percent of total supply. The price increase for imported walnuts was less significant than almonds at 6 percent vs the previous MY which stimulated improved processing/industrial use and growing retail sales. FAS Sofia forecasts walnut consumption in MY 2025/26 to continue to grow to over 11,000 MT, especially in the light of more stable prices (Tables 3 and 4, Trade Section).

    Bulgarian processors are increasingly using nuts in sweet and confectionary products such as waffles, cookies, cakes, desserts, and chocolate. In 2024 and 2025, production of protein snacks increased significantly as most of these products contain nuts. In addition, plant protein-based milk, usually from nuts, became very popular, especially in urban areas. Some of this processing is for products that are exported. Exports of confectionary products (HS#1905) increased by 7 percent to $424 million in CY 2024 compared to $397 million in CY 2023. In January-October 2025, exports increased by about 23 percent compared to the corresponding period in CY 2024 (source: Trade Data Monitor/TDM). The major confectionary producers continued to expand production and to invest in new equipment and larger storage facilities.

    Industry sources expect the tree nut market in MY 2025/26 to be more stable with slower growth rates. This is due to the estimated decrease in local supply, creating opportunities for higher imports. Therefore, import prices will be critical for consumer demand. In September and October 2025 (MY 2025/26), almond imports prices were 37 percent higher than a year ago with imports in volume growing by 19 percent. This signals more modest growth in market/consumption volumes while sales in value will likely continue to expand. In October 2025 (MY 2025/26), walnut import prices dropped by 33 percent while imports in volume skyrocketed more than 5-fold, due to aggressive imports from People’s Republic of China (PRC). If this trend continues, walnut consumption has positive prospects for further growth in volume.

    Trade

    Imports of almonds and walnuts in MY 2024/25 grew to a new record of 10,970 MT over MY 2023/24 (Table 4, Graph 4). This represented a considerable 41 percent increase compared to 7,797 MT imported in MY 2023/24. In terms of value, almond imports reached $16.9 million, and walnut imports $15.0 million, or again a new record ($31.9 million) in tree nuts trade, 36 percent more than the value of tree nuts imports a year before ($23.4 million).

    Almonds: In MY 2024/25, almond imports (Shelled weight [SH]), declined by about 9 percent. In addition to better local supply, another reason for this reduction was the considerable growth in average import price of 22 percent to $6,326/MT compared to $5,165/MT in MY 2023/24 (Trade Data Monitor/TDM) (Table 2 and 4). These prices resulted in expanding imports in value, generating almost 12 percent over MY 2023/24 growth to about $17 million in trade. The bulk of imports were shelled almonds (HS#080212). The main suppliers of almonds to Bulgaria are the United States, Spain, and Greece.

    Imports from the United States (shelled almonds) in MY 2024/25 declined by about 9 percent in tonnage but grew by about 14 percent in value (Table 4) due to 24 percent higher import prices ($6,243/MT vs. $5,023/MT). The United States accounted for 64 percent and 63 percent of imports, in volume and value terms, respectively. Thus, U.S. almonds strengthened their market position as a leading origin. Spain accounted for 11 percent of imports and Greece for 13 percent (volume).

    In the first two months of MY 2025/26 (September and October 2025), almond import prices kept their upward trend at 37 percent higher than a year ago ($7,636/MT vs $5,562/MT). Nevertheless, imports demonstrated resilience and grew by 19 percent (in volume) and by 64 percent (in value) compared to a year ago.

    Walnuts: In MY 2024/25, walnut imports skyrocketed to a new record of about 8,300 MT (In-Shell weight [ISH]), increasing by 70 percent compared to the previous MY (Tables 3 and 4). In terms of value, imports grew to $15.04 million, a 81-percent increase over MY 2023/24 with 6 percent higher import prices for walnuts ($1,813/ MT in MY 2024/25 vs $1,711/MT in MY 2023/24) (Table 4). Shelled walnuts (HS#080232) are generally in higher demand and imports increased to 7,499 MT (ISH) compared to 4,347 MT (ISH) over the previous MY or 73 percent more. Shelled walnuts accounted for 90 percent of total imports versus 10 percent for walnuts in-shell. The PRC and Ukraine are the main suppliers of shelled walnuts with 70 percent and 15 percent share each, respectively, of total imports. Ukraine is also the major supplier of walnuts in shell with 65 percent of imports while the PRC accounts for 27 percent.

    The United States exports both shelled and in-shell walnuts to Bulgaria. However, in MY 2024/25 U.S. walnut imports decreased to only 20 MT in-shell product (ISH) at $43,000, mainly due to strong price-competitive imports from the PRC and Ukraine (Table 4). In the first month of MY 2025/26 (October 2025), walnut import prices reverted their trend and dropped by 33 percent from a year ago ($1,328 MT vs $1,991/MT). As a result, imports grew substantially both in volume (by 513 percent) and in value (by 310 percent) compared to a year ago.

    Major walnut export markets for Bulgaria are Greece, Albania, and Kosovo. In MY 2024/25 walnut exports increased by 110 percent (to 1,673 MT vs 797 MT) compared with the previous MY (Table 4), due to a better total supply. Reportedly, some of these quantities were transshipped and/or further processed imported product.

    Other Tree Nuts: Favorable demand for tree nuts has gradually diversified and expanded to less familiar, high-end tree nuts such as pistachios. In MY 2024/25, pistachio imports (ISH) grew to a new record of 1,423 MT vs 1,308 MT in the previous MY which marked a 9 percent increase despite sharply higher average import price of 45 percent ($10,079/MT vs $6,963/MT). In terms of value, imports were 57 percent higher at $14.34 million (Table 4). Trade in U.S. pistachios (in-shell pistachios) declined by 41 percent in volume and by 26 percent in value, mainly due to expensive prices.

    The United States kept its position of a leading supplier with 30 percent share in total imports. However, some of the product imported from Germany, the second leading supplier, was also of U.S. origin. (Table 4). In October 2025 (MY 2025/26), imports continued to expand with 103 percent growth in imported tonnage and 154 percent increase in value. Import prices were 25 percent higher than a year before but more stable at the average level seen in MY 2024/25 ($10,323/MT).

    By Mila Boshnikova-Petrova, USDA Foreign Ag Service, Bulgaria
  • Hazelnut Sucker Removal

    Hazelnut Sucker Removal

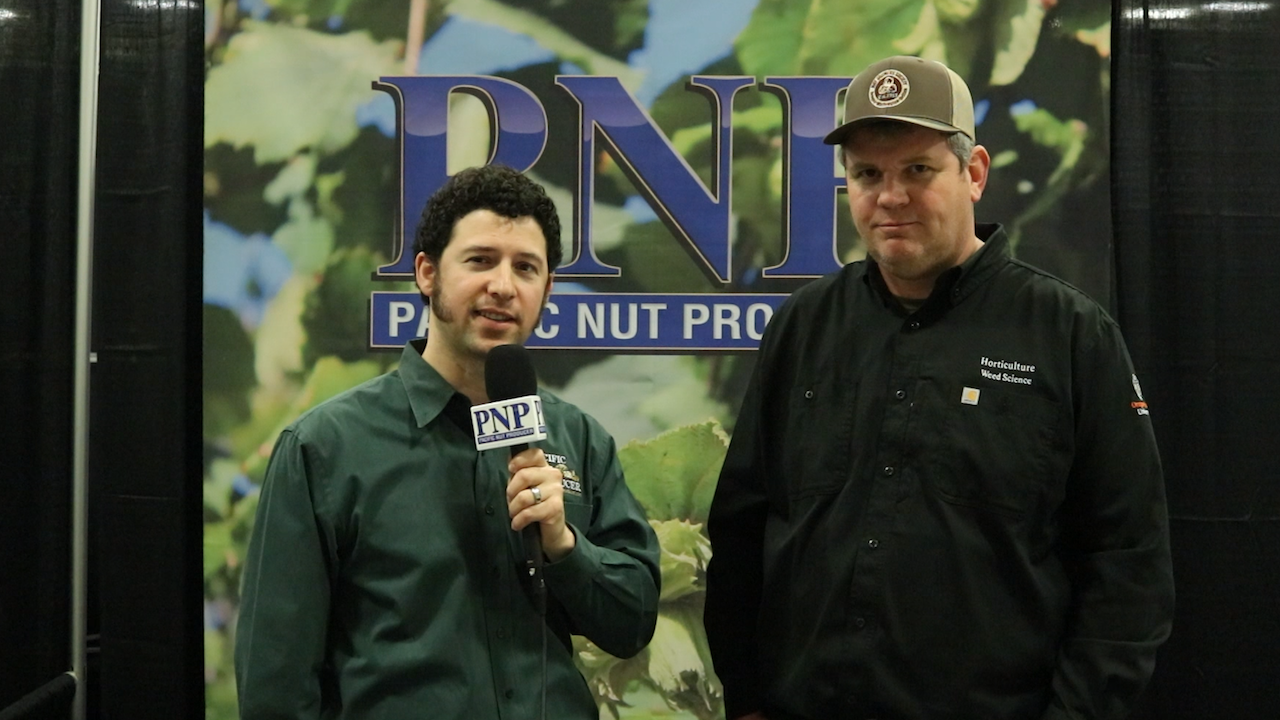
    Hazelnut suckers can be a hassle for growers, as they compete with trees for key nutrients. Removing them regularly is crucial to maintaining a healthy orchard. At the Nut Growers Society’s Winter Meeting, Marcelo Moretti from Oregon State University spoke with Matthew Malcolm of Malcolm Media Ag Publishing about the latest findings on sucker removal practices. Watch this quick video and learn more in Pacific Nut Producer Magazine.

    Please thank this video’s sponsor George Packing Company for their industry support.

  • Turlock Chamber Ag Scholarship Luncheon Approaching

    Turlock Chamber Ag Scholarship Luncheon Approaching

    The Turlock Chamber of Commerce Ag Committee’s 36th annual Ag Scholarship Luncheon is set for March 17 to raise money for aspiring scholars and future growers.

    The Turlock Chamber Ag Committee is a group of local leaders who believe a strong agricultural industry depends on a diverse workforce. Whether a student is pursuing a specialized skill set at a trade school, starting their journey at community college or attending a four-year university, the Committee aims to support their endeavors.

    “We believe that by investing in all forms of higher education, we ensure our community welcomes back a wide range of talent — from technical specialists to researchers and managers — needed to keep our industry competitive,” the Committee stated in a media release.

    Since 2000, the committee has awarded $488,160 to 455 high school seniors from Denair, Delhi, Hilmar, Hughson, Livingston, Pitman, Turlock Christian, Turlock and Waterford.

    “By providing monetary support for trade schools, community colleges and universities alike, we are ensuring that the next generation of agriculture is equipped with the innovation and diverse skills required for the future,” the Committee added.

    The luncheon will be held at the Stanislaus County Fairgrounds, Building E-2 to celebrate scholarship winners and the local businesses that supported it.

  • Almond Board of California Announces 2026 Almond Leadership Program Class

    Almond Board of California Announces 2026 Almond Leadership Program Class

    The Almond Board of California (ABC) announced the 2026 class of its Almond Leadership Program (ALP), welcoming 18 new professionals in the cohort. These industry professionals are committed to strengthening California almond farming and advancing the future of the industry through collaboration, leadership development and innovation.

    The ALP program brings together emerging leaders from across the almond value chain. From growers and agronomists to marketers, processors, field representatives and allied partners, this immersive experience is focused on building leadership skills, industry insight and solving real-world challenges facing California agriculture. Participants will be provided with in-depth exposure to the social, economic, environmental and regulatory forces shaping the future of the California almond industry. Each class member will complete a yearlong, self-directed capstone project focused on addressing a real-world challenge or opportunity for the industry.

    “This program is about preparing the next generation of leaders to navigate complexity, lead with integrity and represent the almond community with confidence,” said Rebecca Bailey, senior specialist overseeing ALP for ABC. “The 2026 class reflects the diversity of perspectives and expertise that will be essential for the long-term success of our industry, and we’re proud to invest in their growth and leadership.”

    Members of the 17th class will not only be working at their full-time jobs but will be involved in every aspect of the industry, including ABC activities in global marketing, production, nutrition research, food safety and more. The program is intended to sharpen their communications skills and build relationships with industry leaders, ABC staff and each other.

    “I joined the Almond Leadership Program because the future of California agriculture depends on thoughtful, engaged leaders who understand both on‑the‑ground realities and the policy landscape,” said Daniel Frea, class member and farmer/attorney at Wanger Jones Helsley PC. “ALP offers a unique opportunity to deepen my industry knowledge, build meaningful relationships and better serve the almond community.”

    Class members also have mentors, many who are ALP graduates, helping them to strengthen their industry knowledge, perspective and skill development.

    “I came into the almond industry without much of an agricultural background. In my first role, I was fortunate enough to work alongside some seasoned almond professionals. I enjoy being a resource to those that are new to or growing in the almond industry,” said Jereme Fromm, mentor and vice president of business development at California Nut Co. “The Almond Leadership Program gives participants an in-depth look into the many facets of the almond industry. Participants are exposed to everything from nutrition research, regulation and trade to market development and on-farm innovation. They also build some great relationships along the way.”

    Continuing a long-standing tradition of service, class members will also raise funds to support California Future Farmers of America (FFA), with a collective goal of raising more than $25,000 in scholarships for high school students pursuing agricultural studies in college. Since the program’s inception, ALP participants have raised more than $320,000 for FFA to help support the next generation of agricultural leaders.

    2026 Almond Leadership Program Participants

    • Rebekah Burrows, Customer Care Specialist | Grower – Owner/Operator, Advancing Eco Agriculture | GGI Farms
    • Grace Fales, Sales Manager, Baugher Ranch Organics
    • Daniel Frea, Attorney / Farmer, Wanger Jones Helsley PC / Frea Farms
    • Austin Jackson, Regional Manager – Member Relations, Blue Diamond Growers
    • Andrew Jensen, CEO / Agronomist, Crop Syndicate
    • Julian Jimenez, Production / Ranch Manager, Pomona Farming LLC
    • Natalie Kidd, Grower, Kidd Farms
    • Catherine Machado, Operational Support Manager, Manulife Farmland Management Services
    • Madison Martella, Grower Relations, Monte Vista
    • Prabh Monder, General Manager, Monder Farms
    • Connor Pate, Manager of Precision Agriculture, Belkorp Ag, LLC
    • Alexus Powell-Crow, Marketing & Communications Manager, Grow West
    • Noah Riley, Western Territory Sales Representative, Kula Bio
    • Hyeong Shin, Broker, HS Ventures
    • Orlando Tapia, Agronomy Specialist, Corteva Agriscience
    • John Unzueta, Procurement Manager, Cache Creek Foods LLC
    • Alyssa Valdez, Grower Relations, RPAC LLC
    • James Williamson, Investment Associate, PGIM Real Estate

    For more information about the Almond Leadership Program and the Almond Board of California, visit almonds.org.

    About California Almonds   
    California Almonds make life better by what we grow and how we grow. The Almond Board of California promotes natural, wholesome and quality almonds through leadership in strategic market development, innovative research, and accelerated adoption of industry best practices on behalf of the more than 7,600 almond farmers and processors in California, most of whom are multi-generational family operations. Established in 1950 and based in Modesto, California, the Almond Board of California administers a grower-enacted Federal Marketing Order under the supervision of the United States Department of Agriculture.

  • Specialty Crops Acreage Reporting Deadline Approaching

    Specialty Crops Acreage Reporting Deadline Approaching

    U.S. Secretary of Agriculture Brooke L. Rollins announced that the U.S. Department of Agriculture (USDA) is providing $1 billion in Assistance for Specialty Crop Farmers (ASCF) Program assistance for specialty crops and sugar, commodities not covered through the previously announced Farmer Bridge Assistance (FBA) program. These one-time bridge payments will help address market disruptions, elevated input costs, persistent inflation, and market losses from foreign competitors engaging in unfair trade practices that impede exports. Specialty crop producers have until March 13, 2026, to report 2025 acres to USDA’s Farm Service Agency (FSA).

    “President Trump has the backs of our farmers, and today we are building on our Farmer Bridge Assistance program with the Assistance for Specialty Crop Farmers (ASCF) Program. Our specialty crop producers continue to feel the negative effects of four years under the Biden Administration, suffering from record inflation, a depleted farm safety net, and delayed disaster assistance,” said Secretary Rollins. “President Trump and the entire cabinet are working every day to fight bidenflation and lower prices for consumers. If our specialty crop producers are not economically able to continue their operations, American families will see a decrease in the food they rely on, wholesome and nutritious fruits and vegetables. Putting Farmers First is essential to the Make America Healthy Again movement and we are doing both at USDA by expanding market opportunities and improving the farm economy for all producers. Today’s specialty crop announcement builds on our efforts to improve markets for real food into American schools, institutions, and family dinner tables.”

    The Assistance for Specialty Crop Farmers Program is authorized under the Commodity Credit Corporation Charter Act and will be administered by FSA.

    Eligible Specialty Crops

    ASCF-eligible specialty crops include: (A) Almond, Apple, Apricot, Aronia berry, Artichoke, Asparagus, Avocado (B) Banana, Bean (Snap or green; Lima; Dry edible), Beet (Table), Blackberry, Blueberry, Breadfruit, Broccoli (including Broccoli Raab), Brussels Sprouts (C) Cabbage (including Chinese), Cacao, Carrot, Cashew, Cauliflower, Celeriac, Celery, Cherimoya, Cherry, Chestnut (for Nuts), Chive, Citrus, Coconut, Coffee, Collards (including Kale), Cranberry, Cucumber, Currant (D) Date, Dry Edible Beans and Peas* (E) Edamame, Eggplant, Endive (F) Feijou, Fig, Filbert (Hazelnut) (G) Garlic, Gooseberry, Grape (including Raisin), Guava (H) Horseradish (K) Kiwi, Kohlrabi (L) Leek, Lettuce, Litchi (M) Macadamia, Mango, Melon (All Types), Mushroom (Cultivated), Mustard and Other Greens (N) Nectarine (O) Okra, Olive, Onion, Opuntia (P) Papaya, Parsley, Parsnip, Passion Fruit, Pea (Garden; English or Edible Pod; Dry edible), Peach, Pear, Pecan, Pepper, Persimmon, Pineapple, Pistachio, Plum (including Prune), Pomegranate, Potato, Pumpkin (Q) Quince (R) Radish (All Types), Raspberry, Rhubarb, Rutabaga (S) Salsify, Spinach, Squash (Summer and Winter), Strawberry, Suriname Cherry, Sweet Corn, Sweet Potato, Swiss Chard (T) Taro, Tomato (including Tomatillo), Turnip (W) Walnut, Watermelon

    *Dry edible beans and peas covered by FBA will not be eligible for ASCF.

    ASCF payments are based on reported 2025 planted acres.

    Eligible farmers should ensure their 2025 acreage reporting is factual and accurate by 5 p.m. ET on March 13, 2026. Commodity-specific payment rates will be released by the end of March. Crop insurance linkage will not be required for the ASCF Program. However, USDA strongly urges producers to take advantage of the new One Big Beautiful Bill Act (OBBBA) risk management tools to best protect against price risk and volatility in the future.

    More information on ASCF is available online at www.fsa.usda.gov/fba or producers can contact their local FSA county office. — By USDA Farm Service Agency

  • USDA Announces $25M for Tree Nuts in Purchase

    USDA Announces $25M for Tree Nuts in Purchase

    U.S. Secretary of Agriculture Brooke L. Rollins announced the U.S. Department of Agriculture’s (USDA) intent to purchase up to $263 million in agricultural products from American farmers and producers to distribute to food banks and nutrition assistance programs across the country. These purchases are being made through USDA’s authority under Section 32 of the Agriculture Act of 1935 and will assist producers and communities in need.

    “From milk and dairy to fruits, legumes, and tree nuts, these staples are essential for feeding families and sustaining America’s agricultural economy,” said Secretary Brooke Rollins. “Through these Section 32 purchases, USDA is delivering wholesome, real food to Americans while injecting critical dollars into local economies. By turning harvests into meals, we are not only stabilizing farm income and protecting rural jobs—we are nourishing our nation and supporting the farmers who feed America. Under President Trump’s leadership, these investments strengthen the food supply, sustain rural communities, and reinforce agriculture as a cornerstone of economic resilience.”

    Agricultural Marketing Service Section 32 Purchases

    AMS continuously purchases a variety of domestically produced and processed agricultural products. These “USDA Foods” are provided to USDA’s Food and Nutrition Service (FNS) nutrition assistance programs, including food banks that operate The Emergency Food Assistance Program (TEFAP), and are a vital component of the nation’s food safety net. USDA AMS will purchase up to $263 million of the following commodities:

    • Butter: $75 million
    • Cheddar Cheese and Cheese Products: $32.5 million
    • Swiss Cheese: $10 million
    • Fresh Fluid Milk: $20.5 million
    • Ultra-High Temperature Milk: $10 million
    • Chickpeas: $12 million
    • Dried Beans (Black and Pinto): $25 million
    • Fresh Pears: $15 million
    • Lentils: $14 million
    • Pecans: $10 million
    • Split Peas: $24 million
    • Walnuts: $15 million

    By USDA

  • Fungicide Drenching to Combat Hazelnut Blight

    Fungicide Drenching to Combat Hazelnut Blight

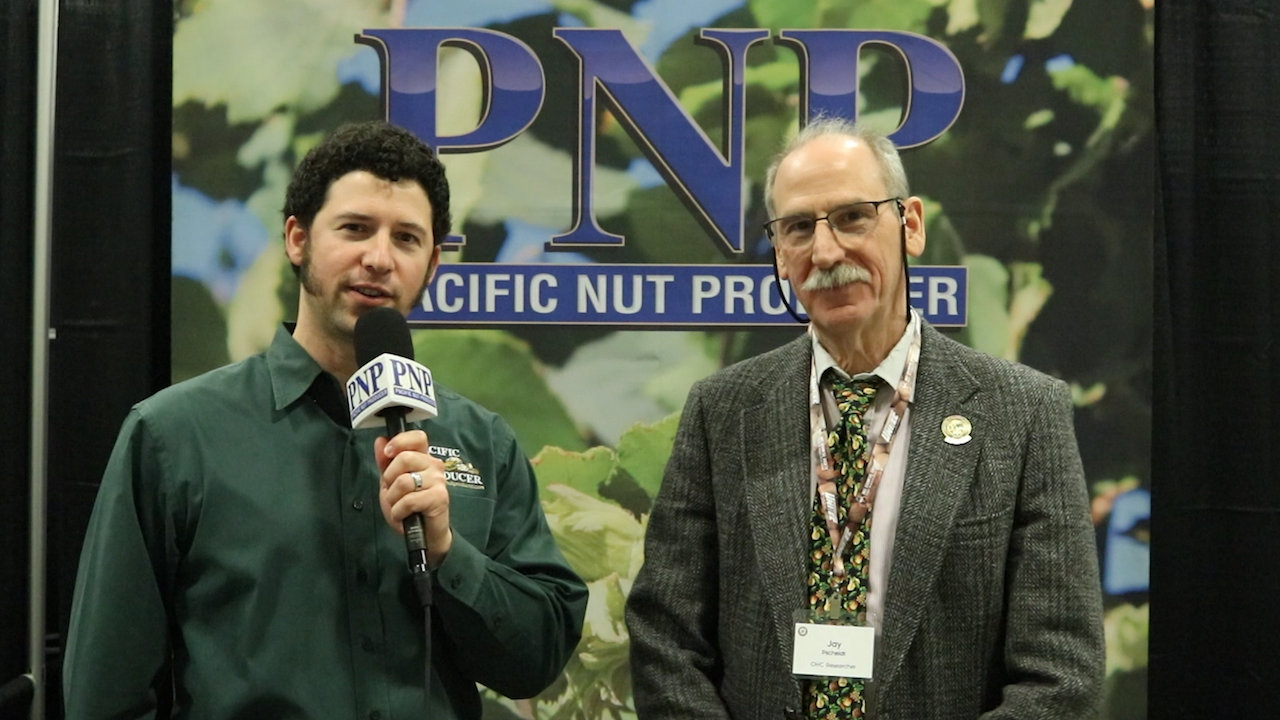
    Eastern filbert blight is an ongoing and costly problem for hazelnut growers, but researchers at the Oregon State Extension are researching newer and more efficient ways to combat it. At the Nut Growers Society’s Winter Meeting, Jay Pscheidt spoke with Matthew Malcolm at Malcolm Media Ag Publishing and shared their findings on drenching. Watch this quick video and read more in Pacific Nut Producer Magazine.

    Please thank this video’s sponsor George Packing Company for their industry support.

  • Turkey Levies Higher Tariffs on Walnuts and Almonds

    Turkey Levies Higher Tariffs on Walnuts and Almonds

    As of February 1, the Turkish government raised the tariff on imported walnuts from 15 to 20 percent. The government also increased the additional financial responsibility tax charged on imported walnuts and shelled almonds.

    Turkey Raises Import Duty and Tax on Imported Walnuts & Almonds

    At the end of December last year, the Turkish government announced its 2026 tariff schedule (TU2026-0001) that raised the duty on imported walnuts from 15 to 20 percent. Post understands from industry sources that new tariff will kick in on February 1 of this year.

    Besides this increase to the customs duty, the Turkish government also raised the additional financial responsibility tax (AFRT) charged on imported walnuts, shelled almonds, coffee, and a few other items with the same February 1 effective date.

    Depending on domestic market conditions, Turkey makes periodic adjustments to the tariff rates and AFRT applied to imported tree nuts. These adjustments are reportedly made in a way to make sure Turkey does not exceed the 43.2 percent bound tariff rate that it’s allowed under the WTO agreement to charge on imported walnuts and almonds.

    This latest move to raise tariffs and the AFRT on imported tree nuts comes after Turkey wiped away its 10 percent retaliatory 232 tariffs on U.S. tree nuts in September of last year. See TU2025-0051 for reporting on the removal of the retaliatory tariffs.

    By USDA Foreign Ag Service Turkiye

  • Opportunities in Turkey for Tree Nut Producers

    Opportunities in Turkey for Tree Nut Producers

    The U.S. Department of Agriculture’s Foreign Agricultural Service (FAS) is now accepting applications for its agribusiness trade mission to Istanbul, Turkey, scheduled for May 11–14. U.S. exporters interested in exploring trade opportunities in Turkey, the Caucasus and Central Asia must apply by Tuesday, Feb. 24, 2026.

    “With stable economic growth and proven demand for high-quality U.S. food in Turkey and the surrounding region, now is the time for U.S. agribusinesses and producers to take advantage of the momentum that President Trump has been building in trade worldwide,” said USDA Under Secretary for Trade and Foreign Agricultural Affairs Luke J. Lindberg. “This trade mission hopes to follow in the successes we’ve had so far under this administration and I’m looking forward to connecting U.S. exporters with key buyers to forge partnerships and tap into these dynamic markets.”

    The U.S. was Turkey fifth-largest supplier of agricultural products in 2024, while Turkey ranked as the 16th-largest market for U.S. agricultural exports – a figure that has grown roughly 45% since 2020. Total U.S. agricultural product exports to Turkey exceed $1.7 billion, including more than $590 million in retail-ready goods like snack and pet foods, fruits, meats and dairy products.

    USDA sees strong opportunities for continuing growth in Turkey and the surrounding region, reflecting increasing consumer demand and expanding supply chains for the product groups including:

    • Tree nuts
    • Soybeans
    • Pulses
    • Dried distiller grains and solubles
    • Seafood
    • Poultry
    • Beef and pork
    • Prepared foods, sauces, condiments, sweets and snacks
    • Live animals, livestock genetics, hides and skins
    • Alcoholic beverages, distilled spirits and wine

    Participants will join buyers from Turkey, Armenia, Georgia, Kazakhstan, Ukraine and Uzbekistan for targeted business-to-business meetings to discuss market opportunities. FAS staff and regional experts will be on hand to host market briefings, site visits and networking events.

    Visit the application page for more information. The application deadline is Tuesday, Feb. 24. — USDA Foreign Ag Service

    The agribusiness trade mission to Türkiye is one of several USDA-led export promotion initiatives in 2026. USDA will announce application details for planned missions to Australia and Saudia Arabia soon. An additional trade mission to Vietnam will follow later in 2026. To learn more about FAS agribusiness trade missions, visit https://www.fas.usda.gov/topics/trade-missions.

  • Phytophthora Sampling in the Stockton East Water District

    This work was partially funded by the Stockton East Water District — Crown rot and root rot caused by Phytophthora species are diseases of great concern for almond growers. Many people believe that irrigating with surface water puts your trees at risk of Phytophthora, and that irrigating with groundwater is the best way to prevent these diseases. However, a recent study of Phytophthora in irrigation water and orchard soils tells a different story.

    The Bottom Line:

    Irrigation management is Phytophthora management. This study showed that Phytophthora is common in orchard soils. Regardless of whether they are irrigated with surface water or groundwater, over 30% of tested orchard soils were positive for Phytophthora. Since water (either standing water or saturated soil) allows Phytophthora to cause disease, good irrigation management is crucial to prevention, no matter what your water source.

    — Reduce ponding: irrigation application rate should not exceed soil infiltration rate.

    —Reduce length of soil saturation: run shorter sets (24 hrs max) more frequently.

    — Avoid water on the trunk of the tree and avoid soil saturation at the trunk: plant on berms, use stream splitters, choose microsprinkler wetting patterns that avoid the trunk, move drip emitters away from the trunk.

    Using a resistant rootstock is an excellent tool to help limit Phytophthora disease if you are planting a new orchard (see this chart for rootstock info) or putting in replants. Even with a resistant rootstock, good irrigation management is crucial because no rootstock is immune.

    The Details:

    Phytophthora is a genus of fungus-like organisms which contains over 200 different species. Many of these species are important pathogens of orchards, causing root rot or crown rot (for example Phytophthora cinnamomi, Phytophthora cactorum, and Phytophthora mediterranea) or pruning wound cankers (mainly Phytophthora syringae). Many previous studies have shown that Phytophthora species are common in surface sources of irrigation water, such as rivers, canals, and sloughs. Phytophthorahas not been found in groundwater from wells, unless that well has been contaminated with surface water. From this, people have assumed that irrigating with surface water puts an orchard at risk of Phytophthora root or crown rot, and that irrigating with groundwater is ”safe.” However, biology is rarely that simple: in my experience, orchards irrigated with groundwater can struggle with Phytophthora, and many orchards irrigated with surface water do not show symptoms of Phytophthora disease.

    In 2021 and 2022, collaborators and I conducted a study to look at the effects of Phytophthora in irrigation water from a broader perspective. This study took place in the Stockton East Water District (SEWD), a local water agency that manages both groundwater and surface water use by agricultural producers east of Stockton, CA. The study had three objectives:

    — Test SEWD surface water for Phytophthora during the irrigation season.

    — Test for live Phytophthora coming through irrigation emitters.

    — Test orchard soils for Phytophthora, comparing orchards irrigated with surface water vs groundwater.

    Objective 1. Test SEWD surface water for Phytophthora during the irrigation season

    During the 2021 irrigation season, we sampled water from surface water irrigation sources throughout the SEWD. Some locations (core sites) were sampled monthly from June through October, and some locations (additional sites) were sampled twice during the season, in July and October. Samples were taken back to the lab and tested for Phytophthora using DNA sequencing.

    Overview of the Stockton East Water District (SEWD) with water sampling sites marked.

    We found that Phytophthora species were common in SEWD waterways. Over the course of sampling, we found 39 Phytophthora species, 10 of which are known pathogens of orchards crops grown in the SEWD. Many of these species were found throughout the irrigation season. We did find that different waterways had different Phytophthora species, and some waterways had more orchard pathogens than others. However, every waterway, and nearly every site, had at least one Phytophthora species of concern to orchards. These results are consistent with many previous studies, which have determined that Phytophthora species are common in surface sources of irrigation water.

    Phytophthora species detected in Stockton East Water District waterways throughout the irrigation season.

    The Phytophthora species listed in this table are reported to cause disease on walnut (W), cherry (C), almond (A), or pistachio (P). If the crop is bold, the Phytophthora species is particularly aggressive on that crop. A plus (+) indicates that the Phytophthora species was detected at least once in that waterway. A period (.) indicates that the species was not detected in that waterway. Nineteen other Phytophthora species (not listed) were detected, but these are not known to cause disease on orchard crops.

    Objective 2. Test for live Phytophthora coming through irrigation emitters

    In objective 1 we determined that Phytophthora is common in the SEWD waterways. However, very few studies have looked at whether Phytophthora in a waterway can get into an orchard through the irrigation system. This is especially true of drip irrigation systems, which require substantial filtration of surface water to keep emitters from plugging.

    During the 2021 and 2022 irrigation seasons, we collected water directly from irrigation emitters during a normal irrigation and tested this water for the presence of live Phytophthora. This was done in three surface-water-irrigated orchards, two with drip emitters and one with sprinklers, as well as two groundwater-irrigated orchards, one with drip emitters and one with sprinklers.

    Orchard sampling stations used to detect live Phytophthora in water from A, sprinklers and B,

    drip emitters.

    We found that Phytophthora commonly survives the journey from surface water sources into the orchard, and that the irrigation system type did not seem to matter. Also, the presence of a sand media filter did not seem to affect how regularly we detected live Phytophthora coming through irrigation emitters.

    Summary of Phytophthora detections in water collected from irrigation emitters

    Objective 3. Test orchard soils for Phytophthora, compare orchards irrigated with surface water vs groundwater

    In objectives 1 and 2 we determined that Phytophthora is common in SEWD waterways and that it can survive the trip through an irrigation system and into the orchard. However, in most cases Phytophthora must survive in the soil to infect the orchard when conditions are right. Even though we knew that irrigation with surface water is bringing Phytophthora into orchards, we didn’t know if this affects the incidence of Phytophthora in orchard soils.

    In 2021, we collected soil from 20 SEWD orchards exclusively irrigated with groundwater for at least 60 years and from 20 SEWD orchards mainly or exclusively irrigated with surface water over the same timeframe. This soil was tested for the presence of Phytophthora species using both the DNA sequencing from objective 1 and the live detection methods from objective 2.

    We found that Phytophthora is common in orchard soils, with 32.5% of sampled orchards (13 out of 40) testing positive. We also found that the source of irrigation water did not affect the chances of finding Phytophthora in the soil: groundwater irrigated orchards were as likely to have Phytophthora as orchards irrigated with surface water. This indicates that irrigation with surface water was not the main factor determining whether Phytophthora was present in orchard soils and that irrigation with surface water may not increase risk of Phytophthora disease in orchards.

    Hytophthora species in bold are particularly aggressive on orchard crops

    The results from this study confirm that Phytophthora is common in surface water but show that irrigating with surface water was not the main factor determining whether Phytophthora was present in an orchard. Where is the Phytophthora coming from? It is hard to know, but historical flooding may play a role. We also know that Phytophthora can be moved into an orchard on planting material and in soil on equipment. Where does this leave us in terms of management? This study shows that Phytophthora is very common in orchard soils, regardless of the source of irrigation water. Since over 30% of tested orchards were positive for Phytophthora, it would be prudent to assume you have Phytophthora in your orchard. Saturated soil allows Phytophthora to infect and cause disease, so good irrigation management is crucial to prevention. By “good irrigation management”, I mean that you want to reduce the length of time that orchard soils are fully saturated and avoid having standing water. This can be done by using irrigation emitters with output volumes suited for your soil infiltration rate and by irrigating more frequently for a shorter duration (24 hrs maximum). In addition, you want to apply irrigation water in the root zone but away from the trunk to reduce the opportunity for infection of the trunk or major roots. This can be done using stream splitters with sprinklers to protect the trunk, choosing a microsprinker wetting pattern that avoids the tree trunk, or moving drip emitters away from the trunk of the tree. At planting, consider using a resistant rootstock, and plant on berms. Note that even if you are using a resistant rootstock, good irrigation management is crucial because no rootstock is immune.

    I want to leave you with this thought: irrigating well is much more important for preventing Phytophthora than the source of your irrigation water. I have been to many surface-water-irrigated orchards with no symptoms of Phytophthora. Some of the worst orchards I have seen, in terms of Phytophthora disease, were irrigated with groundwater with the driplines right against the trunk on 3rdleaf trees. Irrigation management is Phytophthora management.

    Thank you to my collaborators on this project, Greg Browne (USDA-ARS) and Mohamed Nouri (UCCE San Joaquin County). Special thanks to Justin Hopkins with the SEWD for his help planning and executing this project. Thank you also to the SEWD growers who welcomed me into their orchards for sampling. This work was partially funded by the Stockton East Water District. — By Jaime Ott, UC Extension Tehama, Shasta, Glenn, and Butte Counties